Net Lease Cap Rate Trends: What the Latest Market Data Means for Investors
Analysis of Q4 2025 Single-Tenant Net Lease Market Dynamics a Comprehensive Report By Boulder Group.last updated Tuesday, July 21, 2026
#net lease cap rate report #Net lease cap rates
| | by Sidra Jabeen | Content Manager, Paperfree Magazine |
QUICK LINKS
AD
Get Access to Real Estate Investment Opportunities
Based on market analysis originally published by Erika Morphy at GlobeSt.com on January 6, 2026. Original article: Data sourced from The Boulder Group's Q4 2025 Net Lease Report.
Net Lease Cap Rate Report: Market Stabilization After Two Years of Repricing
The single-tenant net lease market has entered a new phase of stability, according to recent data from The Boulder Group's fourth-quarter 2025 report analyzed by GlobeSt.com. After two years of significant repricing driven by rising interest rates and economic uncertainty, cap rates have essentially plateaued, rising just 1 basis point in Q4 2025 to 6.81%.
This stabilization tells an important story for investors: the market has largely absorbed higher borrowing costs and shifted focus from Federal Reserve policy to fundamental risk factors, including tenant credit quality, lease duration, and property-specific characteristics. Understanding these dynamics is essential for accredited investors and institutional buyers looking to optimize returns in the current environment.
The Disconnect Between Interest Rates and Cap Rates
One of the most significant findings from the GlobeSt.com analysis involves what didn't happen in Q4 2025. Despite the Federal Reserve implementing its third rate cut of the year—a 25 basis point reduction bringing the federal funds rate to 3.50%–3.75%—cap rates remained largely unchanged. This represents a notable departure from conventional wisdom, which holds that lower interest rates automatically translate into compressed cap rates.
What This Means for Investors
The historical lag and weak correlation between Fed policy and net lease pricing mean investors should not expect immediate cap rate compression following monetary policy shifts. Instead, the market is demonstrating greater independence, with pricing driven more by property-level fundamentals and sector-specific dynamics. This creates opportunities for sophisticated investors who can evaluate assets based on intrinsic value rather than simply following interest rate trends.
Sector-by-Sector Breakdown: Where to Find Value
Retail: The Premium Sector
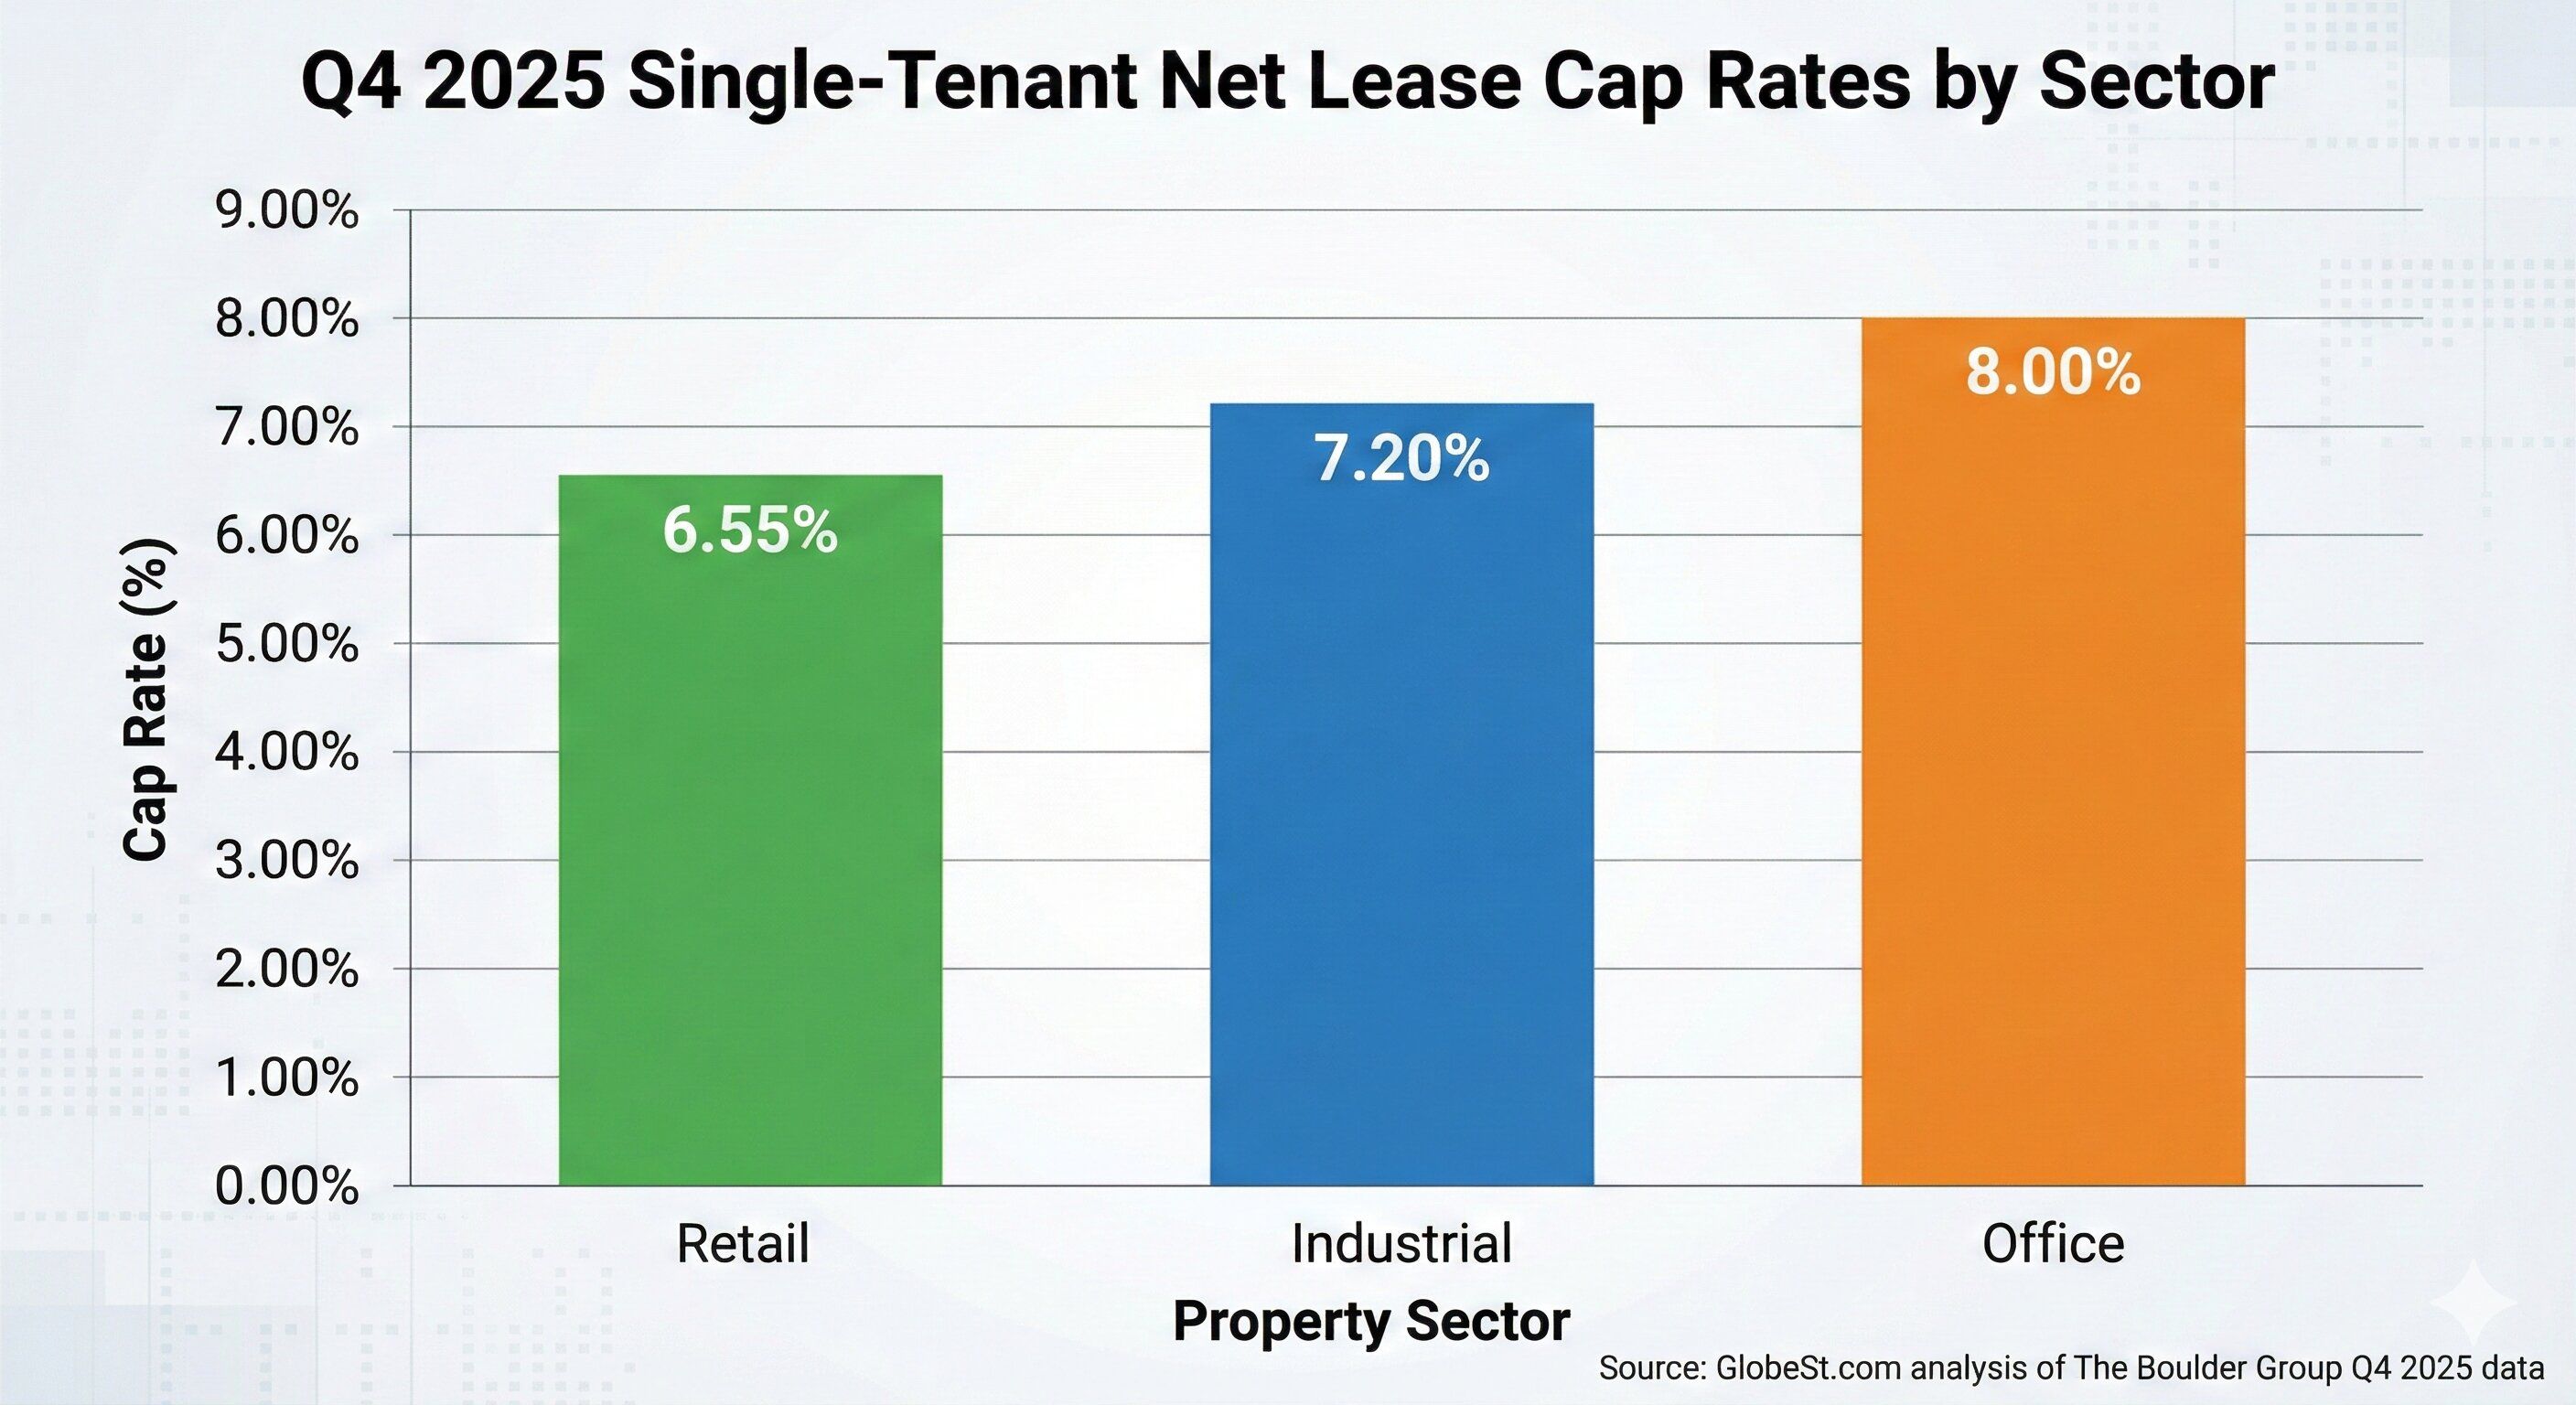
According to data from GlobeSt.com, retail net-lease properties continue to command the tightest cap rates at 6.55%, down 2 basis points in Q4. This premium pricing reflects investor confidence in established retail concepts with strong tenant covenants.
The bid-ask spread in retail narrowed to just 25 basis points, indicating strong alignment between buyers and sellers. This tight spread suggests efficient price discovery and reduced uncertainty—factors that typically benefit both parties in transactions.
Investment Implication: While retail offers stability and liquidity, the compressed cap rates mean investors are paying a premium for quality. Returns will depend heavily on tenant credit and lease structure, rather than on future cap rate compression.
Industrial: Holding Pattern After Repricing
Industrial properties held flat at a 7.20% cap rate, according to GlobeSt.com. This stability follows previous quarters of repricing and comes despite a 5.6% increase in available inventory, bringing 713 industrial properties to market.
The market demonstrated resilience with strong transaction activity, particularly for assets with long-term leases to creditworthy tenants. Notable transactions analyzed in the GlobeSt.com report included an Amazon facility in Oregon trading at a 5.35% cap rate with seven years remaining. At the same time, shorter-term assets commanded yields in the high-6% to low-7% range.
Investment Implication: Industrial offers a middle ground between retail and office, with higher yields than retail but lower risk than office. The increased supply creates opportunities for selective buyers to differentiate between high-quality logistics facilities and secondary locations.
Office: Higher Yields Reflect Market Skepticism
Office properties experienced the most significant movement, with cap rates widening by 10 basis points to 8.00%. As GlobeSt.com's analysis notes, this expansion reflects continued price discovery in a sector facing structural headwinds from remote work trends and uncertain long-term demand.
Supply increased 8.2% quarter-over-quarter to 685 properties, and the bid-ask spread of 50 basis points—double that of retail—indicates less certainty about appropriate pricing levels.
Investment Implication: Office properties offer the highest yields in the net-lease market but carry elevated risk. Investors should focus on properties with strong, creditworthy tenants (such as government agencies or healthcare providers) and locations in markets with positive office fundamentals. Higher cap rates can yield attractive returns for those willing to accept the risk profile.
The Crucial Role of Lease Terms and Tenant Credit
One of the most valuable insights from the GlobeSt.com analysis is how dramatically lease terms affect pricing across all property types. The data reveals that remaining lease duration can create cap rate differentials of 200-300 basis points or more within the same tenant and property type.
Dollar Stores: A Case Study in Lease Term Impact
The dollar store segment provides a clear example of this dynamic. According to the GlobeSt.com report, Dollar General properties with 12-15 years of remaining term trade around 6.90%, while those with less than 3 years of remaining term trade around 9%. Family Dollar shows an even more pronounced effect, with short-term leases commanding cap rates near 9.50%.
This spread reflects fundamental investment risk: shorter lease terms mean earlier re-tenanting risk, potential downtime, and uncertainty about future rental rates. For value-focused investors, this creates a critical decision point between accepting lower current yields for long-term stability and accepting higher yields with near-term execution risk.
Quick-Service Restaurants: Corporate vs. Franchisee Premium
The QSR segment analyzed by GlobeSt.com reveals another important distinction: corporate-backed locations trade at significantly lower cap rates than franchisee-operated stores. Corporate QSR assets average 5.85%, while franchisee properties command 6.75%.
This 90-basis-point differential reflects concerns about credit quality. Corporate guarantees from established brands like McDonald's or Chick-fil-A provide stronger covenant protection than individual franchise operators, even when the brand and location are identical.
Investment Strategy: Investors seeking maximum security should focus on corporate-backed locations with long-term leases and accept lower cap rates to reduce risk. Those comfortable with credit analysis and willing to evaluate individual franchisees' strength can capture an additional 90 basis points while potentially maintaining reasonable risk profiles.
Drugstore Divergence: Credit Matters
Perhaps no sector better illustrates the importance of tenant credit than the drugstore sector. The GlobeSt.com analysis shows Walgreens properties trading at 8.00% cap rates—133 basis points higher than CVS locations at 6.67%. This substantial spread reflects market concerns about Walgreens' financial performance and long-term viability relative to CVS.
For sophisticated investors, this creates a risk-reward calculation: Is the additional 133 basis points of yield sufficient compensation for elevated credit risk? The answer depends on the quality of the individual location, the remaining lease term, and assumptions about Walgreens' ability to honor its obligations throughout the lease.
Supply Dynamics: Opportunity in Elevated Inventory
GlobeSt.com's analysis notes that market supply reached its highest level in over a decade, with 5,710 properties available—a 2.5% increase from the prior quarter. For buyers, this elevated inventory creates a more favorable negotiating environment than existed during the capital-constrained periods of 2022-2024.
The narrowing bid-ask spreads across all sectors suggest this increased supply is not creating distress, but rather enabling more efficient price discovery. Retail spreads compressed to 25 basis points, industrial to 29 basis points, and even office—the most uncertain sector—tightened to 50 basis points.
Buyer Advantage: The combination of elevated supply and tight bid-ask spreads means buyers can be selective without facing aggressive competition or unrealistic seller expectations. This is particularly valuable for investors with specific geographic, tenant, or lease-term requirements, who can now find suitable opportunities more readily than in prior years.
Real-World Transactions: Pricing in Practice
The GlobeSt.com analysis includes several actual fourth-quarter transactions that illustrate how the various factors discussed translate into real pricing:
Premium Assets: A Chick-fil-A location in California traded at just 4.30% with 15 years remaining, while a Sprouts grocery store in Florida commanded 5.47% with 15 years remaining. These ultra-low cap rates reflect strong tenant credit and long-term cash flow certainty.
Middle Market: Industrial facilities with solid but not exceptional credit profiles traded in the mid-5% to low-7% range. An Amazon facility commanded 5.35% despite only seven years remaining, demonstrating the value of exceptional tenant credit.
Higher Yield Opportunities: A 24 Hour Fitness property in Denver sold at 9.45% with just 3 years of lease term remaining, while an Academy Sports location traded at 7.50% with 7 years of lease term remaining. These higher yields reflect either shorter lease terms or sectors facing headwinds.
Strategic Implications for Accredited Investors
1. Focus on Fundamentals, Not Fed Policy
The key lesson from GlobeSt.com's analysis is that the net-lease market has decoupled from short-term interest-rate movements. Investors should evaluate properties based on tenant credit quality, lease structure, and location fundamentals rather than attempting to time Federal Reserve decisions.
2. Quantify the Value of Lease Duration
With lease terms creating 200-300 basis-point differentials, investors must carefully assess whether higher yields on shorter leases adequately compensate for re-tenanting risk. This requires an honest assessment of local market conditions, property quality, and the likelihood of tenant replacement.
3. Consider Sector Allocation Strategically
The 135-basis-point spread between retail (6.55%) and office (8.00%) represents a clear risk premium. Investors should construct portfolios that align with their risk tolerance and return objectives, potentially blending sectors to achieve target yields while managing downside exposure.
4. Leverage Improved Market Conditions
The elevated supply and compressed bid-ask spreads noted in the GlobeSt.com analysis create a more favorable environment for selective buying than existed during recent capital-scarce periods. Patient investors with clear criteria can find opportunities that meet their specific requirements.
5. Differentiate Within Categories
Not all QSR properties trade alike (corporate vs. franchisee), and not all drugstores command the same pricing (CVS vs. Walgreens). Successful investors will dig deeper than broad sector classifications to understand the specific risk-return characteristics of individual opportunities.
Looking Ahead to 2026
The stabilization documented in GlobeSt.com's analysis suggests the net lease market has reached a new equilibrium after two years of adjustment. This creates a more predictable environment for investment decision-making, though several factors warrant monitoring:
Economic Performance
Tenant credit quality depends on broader economic conditions. A recession or significant slowdown could pressure sectors such as casual dining and value retail.
Interest Rate Trajectory
While the market has shown resilience to Fed policy, a dramatic reversal toward higher rates could still impact pricing, particularly for highly leveraged buyers.
Sector-Specific Trends
The office sector's trajectory remains uncertain given the permanence of remote work. Retail and industrial fundamentals appear more stable but require continued monitoring.
Supply-Demand Balance
Whether the elevated inventory levels persist or decline will influence negotiating dynamics and pricing power throughout 2026.
Net Lease Cap Rates: A Mature Market Requires Sophisticated Analysis
The net lease market analysis published by GlobeSt.com reveals a sector that has matured beyond simple interest-rate sensitivity toward more nuanced, risk-based pricing. The minimal movement in the cap rate in Q4 2025, despite Federal Reserve action, demonstrates that investors are now focused on fundamental property characteristics rather than macroeconomic policy.
For accredited investors and institutions, this creates both challenges and opportunities. The challenge lies in the need for more sophisticated analysis—evaluating tenant credit, quantifying lease term value, and understanding sector-specific dynamics. The opportunity arises from a more rational pricing environment in which diligent analysis can identify assets offering appropriate risk-adjusted returns.
The market's message is clear: success in net lease investing now requires understanding not just that cap rates have stabilized, but why they've stabilized at different levels across properties, tenants, and lease structures. Those who master these distinctions will be well-positioned to build portfolios that deliver consistent returns throughout 2026 and beyond.
Disclaimer: This article is for informational purposes only and should not be construed as investment advice. Readers should conduct their own due diligence and consult with qualified professionals before making investment decisions. This analysis is based on market data and reporting from GlobeSt.com and The Boulder Group as of Q4 2025.
Source Attribution: This article analyzes market trends based on reporting by Erika Morphy published at GlobeSt.com on January 6, 2026, utilizing data from The Boulder Group's Q4 2025 Net Lease Report. Original article available at: https://www.globest.com/2026/01/06/net-lease-cap-rates-hit-a-holding-pattern-as-investors-reprice-risk-not-rates/

Pages Related to #net lease cap rate report
- 3 Common Risks of Super Jumbo Loans

- 6 Reasons Why Jumbo Mortgage Refinance is a Good Option

- Everything you need to know when Looking for an Owner Occupied Hard money Loan

- [closed] CMF. Cedar Multifamily Fund
![[closed] CMF. Cedar Multifamily Fund](https://d2sv4n3pfes7l9.cloudfront.net/file_paperfree_144_2020-8-21-19-57-p_pf-avatar.jpg)
- EB-5 Project Approval Process for Regional Center Investments

- From F-1 Visa to Green Card: Navigating U.S. Immigration
- April 2025 Visa Bulletin: Key Updates for EB-5 Investors

- US May 2025 Visa Bulletin: 7-Month Delay in EB-5 for Indian Applicants – What You Need to Know

Popular Page
Private Real Estate Funds - Investments to Drive Income and Capital Growth
Book a Free Complimentary Call
Search within Paperfree.com
real estate investing Investment Visa USA Investment Magazine Private Real Estate Funds real estate funds