Alternative Investment Outlook H2 2025: Interest Rate Impact, Deal Flow Recovery & Investment Opportunities
Navigating Interest Rate Shifts, Deal Flow Recovery & Smart Allocation Strategies | Where Institutional Money is Moving and Why You Should Pay Attention?last updated Tuesday, July 21, 2026
#Alternative Investment Outlook #H2 2025 alternative investments
| | by Sidra Jabeen | Content Manager, Paperfree Magazine |
QUICK LINKS
AD
Get Access to Real Estate Investment Opportunities
Alternative Investment Outlook 2025: Key Takeaway
We're entering a "higher-for-longer" rate environment that's fundamentally reshaping how smart money invests. While public markets look expensive and uncertain, alternative investments—especially private equity, private credit, infrastructure, and real assets—are offering better returns with less volatility. The good news? Deal activity is bouncing back, and savvy investors who position themselves now stand to benefit significantly.
H2 2025 Alternative Investments: Understanding Where We Stand Today
What's Happening with Interest Rates?
Think of the Federal Reserve as the conductor of an economic orchestra. After aggressively raising rates throughout 2023-2024 to combat inflation, they've hit the pause button. The federal funds rate is holding steady at 5.25-5.50%, and it's likely staying there through much of 2025.
BlackRock, one of the world's largest asset managers, projects rates will only gradually decline to around 3.6% by the end of 2025, with a potential drop to 3.4% by late 2026. What does this mean for you?
Higher-for-longer rates create attractive income opportunities in credit investments, but they make leveraged buyouts more expensive.
- 5.25% Current Fed Funds Rate Range (Upper Bound).
- 3.6% Projected Rate by End 2025.
- 48% Deal Value Increase H1 2025 vs H1 2024.
1. Macro & Policy Landscape
1.1 Federal Reserve & Rates
The Federal Reserve ended its tightening cycle in mid-2024, keeping the federal funds rate steady at 5.25–5.50% into early 2025. While inflation has moderated, policymakers remain cautious, signaling that premature cuts could re-stimulate price pressures. Current market consensus points toward gradual easing in late 2025, with the terminal rate expected around 3.6% by year-end if conditions allow.
Implications for investors include:
- Private Credit: Higher-for-longer rates preserve attractive income spreads, reinforcing demand for direct lending, mezzanine, and structured credit strategies.
- Private Equity: Leveraged deal economics remain challenged, requiring more disciplined capital structures and creative financing solutions.
- Fixed Income: Yield curve steepening is underway, with short-term yields expected to decline modestly while long-term yields remain anchored by fiscal deficits and inflation uncertainty.
Overall, the Fed’s cautious stance keeps the policy environment restrictive but stable, with financial conditions supportive of credit-oriented and income-focused alternatives.
1.2 Inflation, Geopolitics & Policy Shocks
Inflation has come off its pandemic-era peaks but remains sticky, reflecting lingering supply-chain bottlenecks, elevated labor costs, and energy price volatility. While core inflation has slowed, headline figures are under upward pressure from policy-driven shocks such as tariffs.
Key developments shaping the outlook:
- Tariffs & Trade Policy
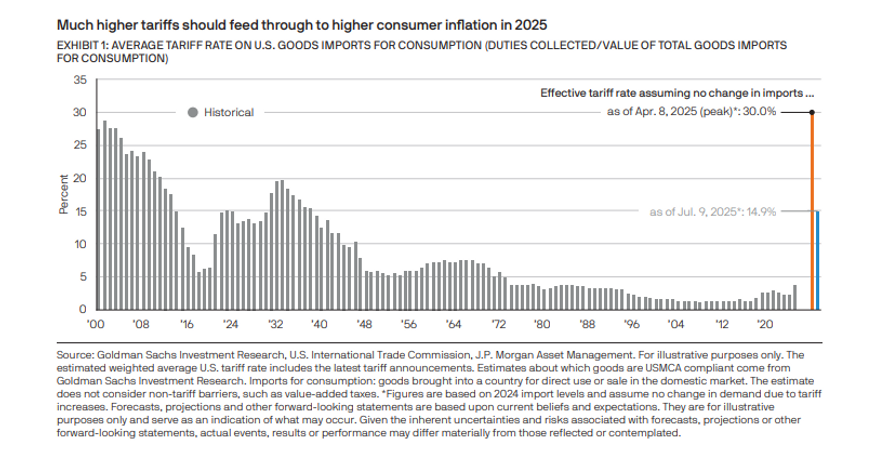
The U.S. sharply increased tariff rates in early 2025, raising the average applied tariff on imports from 2.5% to nearly 15%. These measures are expected to add ~1% to consumer inflation by year-end, complicating the Fed’s path toward its 2% target. They also inject volatility into cross-border M&A, particularly in supply-chain–sensitive industries such as industrials, autos, and semiconductors. - Geopolitical Risks
Ongoing conflicts, shifting alliances, and trade disputes heighten volatility across global markets. “Friendshoring” of supply chains and renewed defense spending are shaping capital flows toward infrastructure, logistics, and energy transition assets. - Immigration & Demographics
U.S. immigration policy has tightened significantly, with illegal border crossings and visa issuances both declining. This points to a structurally slower expansion in the working-age population, reinforcing labor market tightness, supporting wage growth, but also limiting long-term GDP potential. For investors, this dynamic suggests continued cost pressures in labor-intensive sectors, but also sustained demand for automation, AI adoption, and productivity-enhancing technologies.
Taken together, the macro landscape suggests that H2 2025 will be characterized by moderate growth, elevated inflation risks, and persistent policy uncertainty. For allocators, this reinforces the need to balance income generation and inflation hedging with diversification across geographies, sectors, and GP relationships.
2. Policy Shifts from the 2025 Mid-Year Outlook
Insights from J.P. Morgan Asset Management’s 2025 Mid-Year Outlook: Driving in a Complicated Landscape highlight how policy shifts are reshaping growth, inflation, and investment strategy in H2 2025. These dynamics add complexity to portfolio construction but also create opportunities for alternative allocators to balance return generation with resilience.
2.1 Tariffs, Immigration & Fiscal Policy
- Tariffs
U.S. average tariff rates surged from 2.5% to 14.9% by mid-2025, among the steepest increases in decades. This is projected to add ~1% to consumer inflation, creating cost pressures across manufacturing, retail, and technology supply chains. Corporates are increasingly pivoting to “friendshoring” and regionalized production models. - Immigration
Border crossings declined sharply (from 100,000+ per month in late 2024 to ~12,000 in early 2025). Visa restrictions and deportations suggest net immigration could fall to just a few hundred thousand annually, tightening labor supply and reinforcing wage-driven inflation. - Fiscal Stimulus
The “One Big Beautiful Bill Act” (OBBBA) enacted sweeping household tax cuts, retroactive to January 2025. While this boosts disposable income and consumer spending power in the near term, inflationary pressures from tariffs could offset much of the benefit by late 2025.
2.2 Growth & Inflation Path
- Growth
U.S. GDP is projected to slow to ~1% in Q4 2025 as higher tariffs, elevated rates, and labor constraints weigh on activity. However, growth is expected to rebound toward ~2% in 2026 as tax cuts and productivity improvements gain traction. - Inflation
The PCE deflator is forecast to climb to 3.2% by year-end 2025, delaying the Fed’s path back to its 2% target until at least late 2026. Wage stickiness and commodity price volatility remain key upside risks. - Fed Policy
The Federal Reserve is likely to cut rates just once in 2025 (if at all), preferring to wait for clearer signs of disinflation before resuming a gradual easing cycle in 2026.
2.3 Market Allocation Signals
- Quality Assets Favored
With policy-driven uncertainty and elevated inflation, investors are tilting toward quality assets with strong balance sheets, stable cash flows, and pricing power. Cyclical and highly levered exposures are less attractive. - Diversification Returns
The April 2025 market sell-off underscored the resilience of duration, value stocks, and international equities, which outperformed U.S. growth-heavy indices. - Alternatives as Offense & Defense
Alternatives play a dual role:- Offense: Private equity, venture capital, and private credit capture growth opportunities in innovation and direct lending.
- Defense: Infrastructure, hedge funds, and real assets act as portfolio stabilizers, offering inflation protection and low correlation to public markets.
2.4 Summary Table – Key Policy Shifts & Investment Implications
| Policy Driver | Development (H1–H2 2025) | Market Impact | Investor Implications |
|---|---|---|---|
| Tariffs | Avg. tariff rate rose from 2.5% → 14.9% | Adds ~1% to inflation; disrupts global supply chains | Favor supply-chain resilient sectors; monitor cost pass-through |
| Immigration | Border crossings fell from 100k+ → ~12k per month | Smaller labor pool; wage growth acceleration | Wage inflation pressures; opportunities in automation/AI |
| Fiscal Policy (OBBBA Act) | Retroactive tax cuts effective Jan 2025 | Boosts consumer income in early 2026 | Near-term demand lift; offset by tariff-driven inflation |
| Growth Outlook | GDP slows to ~1% in Q4 2025, rebounds to ~2% in 2026 | Short-term drag, medium-term stabilization | Maintain selective growth exposure; emphasize quality assets |
| Inflation Outlook | PCE at 3.2% YE 2025; Fed target delayed to 2026 | Delayed disinflation path | Inflation hedges (infra, real assets) remain essential |
| Fed Policy | Likely just 1 rate cut in 2025; cautious into 2026 | Yields remain elevated; liquidity tight | Private credit income attractive; careful on duration exposure |
3. Deal Flow Recovery Signals
Despite persistent macro risks, deal flow across private markets is showing encouraging signs of recovery. Activity is increasingly characterized by larger, conviction-led deals, greater reliance on private credit, and innovative GP-led structures to address liquidity needs.
3.1 Private Equity
- Buyout Activity
H1 2025 global buyout deal value totaled $289.9B, a 48% increase YoY, even as deal counts declined. This demonstrates renewed appetite for larger-scale transactions. - Public-to-Private Deals
Take-privates remain robust, with 26 transactions totaling $76.3B, the third-strongest half-year tally since 2020. - M&A Divergence
In Q2 2025, global M&A volume fell 17% YoY while deal value surged 30% to $969B. Investors are deploying selectively into fewer but higher-quality targets, often in defensive or growth-critical sectors.
3.2 Credit & Loans
- Syndicated Loan Issuance
Rebounded to $73.5B in Q2 2025, supported by improving secondary market prices. However, issuance remains below Q1’s $354B. - Private Credit Expansion
With bank lending constrained, private credit has stepped in as the dominant financing source. Dry powder exceeds $1T, with AUM projected to rise to $2.6T by 2029, underscoring its structural growth.
3.3 Secondaries & GP-Led Deals
- Secondary Market
LP-led transactions reached $87B in 2024, the strongest in nearly a decade. This reflects LPs’ rising need to unlock liquidity and rebalance portfolios. - GP-Led Structures
Continuation funds and NAV-based facilities are helping sponsors return cash, extend holding periods, and manage fund-level liquidity without relying on IPOs or trade sales.
3.4 Summary Table – Deal Flow Trends
| Segment | 2025 Update | YoY Change | Investor Takeaway |
|---|---|---|---|
| Buyouts | $289.9B value, fewer deals | +48% value, lower volume | Market favors high-conviction, scaled transactions |
| Public-to-Private | $76.3B across 26 deals | 3rd-strongest since 2020 | Valuation arbitrage remains attractive |
| M&A | $969B value, 17% fewer deals | +30% value | Selectivity in large, strategic acquisitions |
| Syndicated Loans | $73.5B rebound in Q2 | Recovery from April low | Opportunities in higher-quality issuance |
| Private Credit | $1T dry powder, AUM to $2.6T by 2029 | Structural growth | Yield + downside protection; replaces banks in financing |
| Secondaries | $87B in 2024; momentum into 2025 | Highest since 2016 | Key liquidity lever; NAV-based lending gaining traction |
4. Investor Sentiment & Allocation Trends
LP sentiment reflects cautious optimism. Allocators are preparing for more active deployment in H2 2025, but concerns around performance dispersion, transparency, and liquidity remain front of mind.
4.1 LP Outlook
- Deal Activity
78% of LPs expect a pickup in private market deal activity within the next 12 months; 15% anticipate a sharp increase. - Performance Satisfaction
Just 16% of LPs say returns exceeded expectations, compared to 20% in prior surveys. 31% report underperformance, pointing to rising dispersion among GPs. - Transparency & Technology
While 46% of LPs rate GP transparency above average, 81% want consolidated portfolio-monitoring tools for reporting, analytics, and cash-flow management.
4.2 Allocation Moves
- Increases
62% of LPs intend to raise alternatives exposure, with 36% targeting >10% allocation growth. - Overweights
Private equity (45%), infrastructure (13%), and venture capital (13%) remain the primary overweights. - Underweights
Real estate (26%) and hedge funds (20%) continue to face skepticism due to liquidity and performance concerns.
4.3 GP Diversification
- Expanding Relationships
62% of LPs plan to increase their GP relationships, with a preference for blending large-cap sponsors with smaller and mid-sized funds (<$500M). - Reporting Enhancements
LPs seek better data analytics (59%) and standardized ILPA reporting templates (34%) to improve oversight and comparison.
4.4 Summary Table – LP Sentiment & Allocation
| Category | Key Findings (2025) | Implication for Allocators |
|---|---|---|
| Deal Outlook | 78% expect increased deal activity | Position portfolios for rising deployment opportunities |
| Performance | 31% see underperformance; 16% exceeded | Manager selection & dispersion risk critical |
| Transparency | 81% want consolidated monitoring tools | Tech-enabled solutions essential |
| Allocations | 62% plan increases; 36% >10% growth | Strong inflows to alternatives continue |
| Overweights | PE (45%), infra (13%), VC (13%) | Core growth-oriented allocation |
| Underweights | Real estate (26%), hedge funds (20%) | Liquidity & performance drag deter inflows |
| GP Diversification | 62% expanding GP relationships | Blend large-cap and niche funds for de-risking |
5. Sector & Strategy Insights
Different strategies and sectors show varied levels of opportunity as H2 2025 unfolds.
5.1 Private Equity
- Valuations
Large-cap buyout multiples remain 37% below 2021 peaks, creating attractive entry points. - Add-On Deals
Account for 75.9% of buyout volume in Q2 2025, emphasizing buy-and-build strategies. - Sector Focus
Technology, healthcare, and industrials account for over two-thirds of new deals, with services (25%) and TMT (19%) leading.
5.2 Private Credit
- Yield Advantage
Senior secured loans, mezzanine, and direct lending continue to deliver spreads well above Treasuries. - Risk Management
Defaults remain low and covenant structures are tighter, offering downside protection even in a higher-rate environment.
5.3 Infrastructure & Real Assets
- Fundraising
Infrastructure strategies raised $134.3B in H1 2025, already surpassing 2024’s total. - Themes
Energy transition, digital infrastructure, and logistics remain the top drivers. - Real Estate
Data centers and logistics hubs trade at premium valuations, while traditional real estate remains challenged.
5.4 Hedge Funds & Liquid Alternatives
- Resurgence
Hedge funds are regaining traction as allocators seek uncorrelated returns. - Strategies in Demand
Market-neutral and multi-strategy funds attract inflows, especially among liquidity-conscious investors managing equity and bond beta.
5.5 Summary Table – Sector Opportunities
| Asset Class | H2 2025 Positioning | Key Drivers |
|---|---|---|
| Private Equity | Entry opportunities at reset valuations | Buy-and-build, tech/healthcare/industrials |
| Private Credit | Elevated yields, tighter covenants | Bank retreat; sticky rates |
| Infrastructure | $134.3B fundraising in H1 2025 | Energy transition, digital infra, logistics |
| Real Assets | Premium for data centers/logistics | Inflation hedge + resilient demand |
| Hedge Funds / Liquid Alts | Regaining inflows, focus on uncorrelated | Market-neutral & multi-strategy approaches |
6. Allocation Recommendations
| Category | Recommendation | Key Rationale |
|---|---|---|
| Private Equity | Partner with top-quartile managers in tech, healthcare, and industrials; use co-investments and continuation funds | Capture sector growth, manage fees, and extend investment horizons |
| Private Credit | Prioritize senior, secured lending with strong covenants; monitor NAV-based financing risks | Generate attractive yields with downside protection in higher-rate environment |
| Infrastructure & Real Assets | Focus on renewables, digital infrastructure, and logistics; ensure global diversification | Provide inflation hedging and exposure to essential, resilient growth themes |
| Liquidity Enhancements | Use secondaries to recycle capital and add liquid alternatives for hedging | Improve capital efficiency and smooth portfolio drawdowns |
| GP Diversification & Reporting | Expand GP relationships with mid-sized differentiated managers; upgrade monitoring and ESG tools | De-risk portfolios, enhance transparency, and align with LP reporting expectations |
Conclusion
As H2 2025 Alternative Investments forecast unfolds, alternative investments are positioned at the nexus of resilient income, structural growth, and macro-policy volatility. Elevated rates, shifting tariffs, and fiscal reforms complicate the outlook, yet dealmaking momentum is returning.
Allocators who maintain balanced exposure across private equity, private credit, infrastructure, and liquid alternatives, while diversifying GP relationships and adopting advanced reporting technologies, will be best placed to achieve durable, risk-adjusted returns and portfolio resilience.
Acknowledgment: This article integrates insights from multiple sources, including J.P. Morgan Asset Management’s 2025 Mid-Year Outlook: Driving in a Complicated Landscape (authored by Gabriela Santos and Dr. David Kelly, CFA).

Pages Related to #Alternative Investment Outlook
- 7 Tips for easily getting Jumbo Mortgage Loans

- Hard Money Lending VS Real Estate Crowdfunding

- Hard Money Lending versus Real Estate Crowdfunding
- How to Spot and Avoid Hard Money Scams

- Hard Money Jumbo Loans in 2025: Latest CFPB Updates & Analysis

- 3 solutions for bad credit home loans | Paperfree

- Why lenders love jumbo mortgage

- 8 Common Reasons Why Borrowers Choose Commercial Hard Money Loans

Popular Page
Private Real Estate Funds - Investments to Drive Income and Capital Growth
Book a Free Complimentary Call
Search within Paperfree.com
real estate investing Investment Visa USA Investment Magazine Private Real Estate Funds real estate funds