REIT Sector Performance Q3 2025: Data Centers & Industrial Lead Recovery
Q3 2025 REIT Performance Analysis: Data Centers and Industrial REITs Drive Market Recovery with Exceptional Growthlast updated Thursday, January 15, 2026
#REIT sector performance Q3 2025 #data center REITs 2025
|
|
by John Burson |
Content Manager, Paperfree Magazine |

QUICK LINKS
AD
Get Access to Real Estate Investment Opportunities
The Real Estate Investment Trust (REIT) sector demonstrated remarkable resilience and growth divergence in Q3 2025, with data centers and industrial REITs emerging as clear winners while traditional sectors continue facing structural headwinds. For investors seeking inflation-protected income, an inflation hedge, and exposure to transformative trends, understanding these performance patterns is crucial for portfolio allocation.
Executive Summary
The REIT landscape in Q3 2025 tells a compelling story of sector bifurcation. While the overall sector maintains a robust $1.4 trillion market capitalization, performance varies dramatically across property types:
Top Performers:
- Data Centers: 21.3% year-over-year FFO growth
- Industrial REITs: Resilient 8.0% FFO growth
- Healthcare REITs: 18.0% FFO growth with 24.2% YTD returns
Underperformers:
- Office REITs: -5.5% FFO growth and -19.7% YTD returns
- Hotel REITs: -18.8% YTD returns despite 12.0% Q3 FFO growth
This divergence reflects fundamental shifts in how we work, live, and consume technology, creating both challenges and opportunities for astute investors.
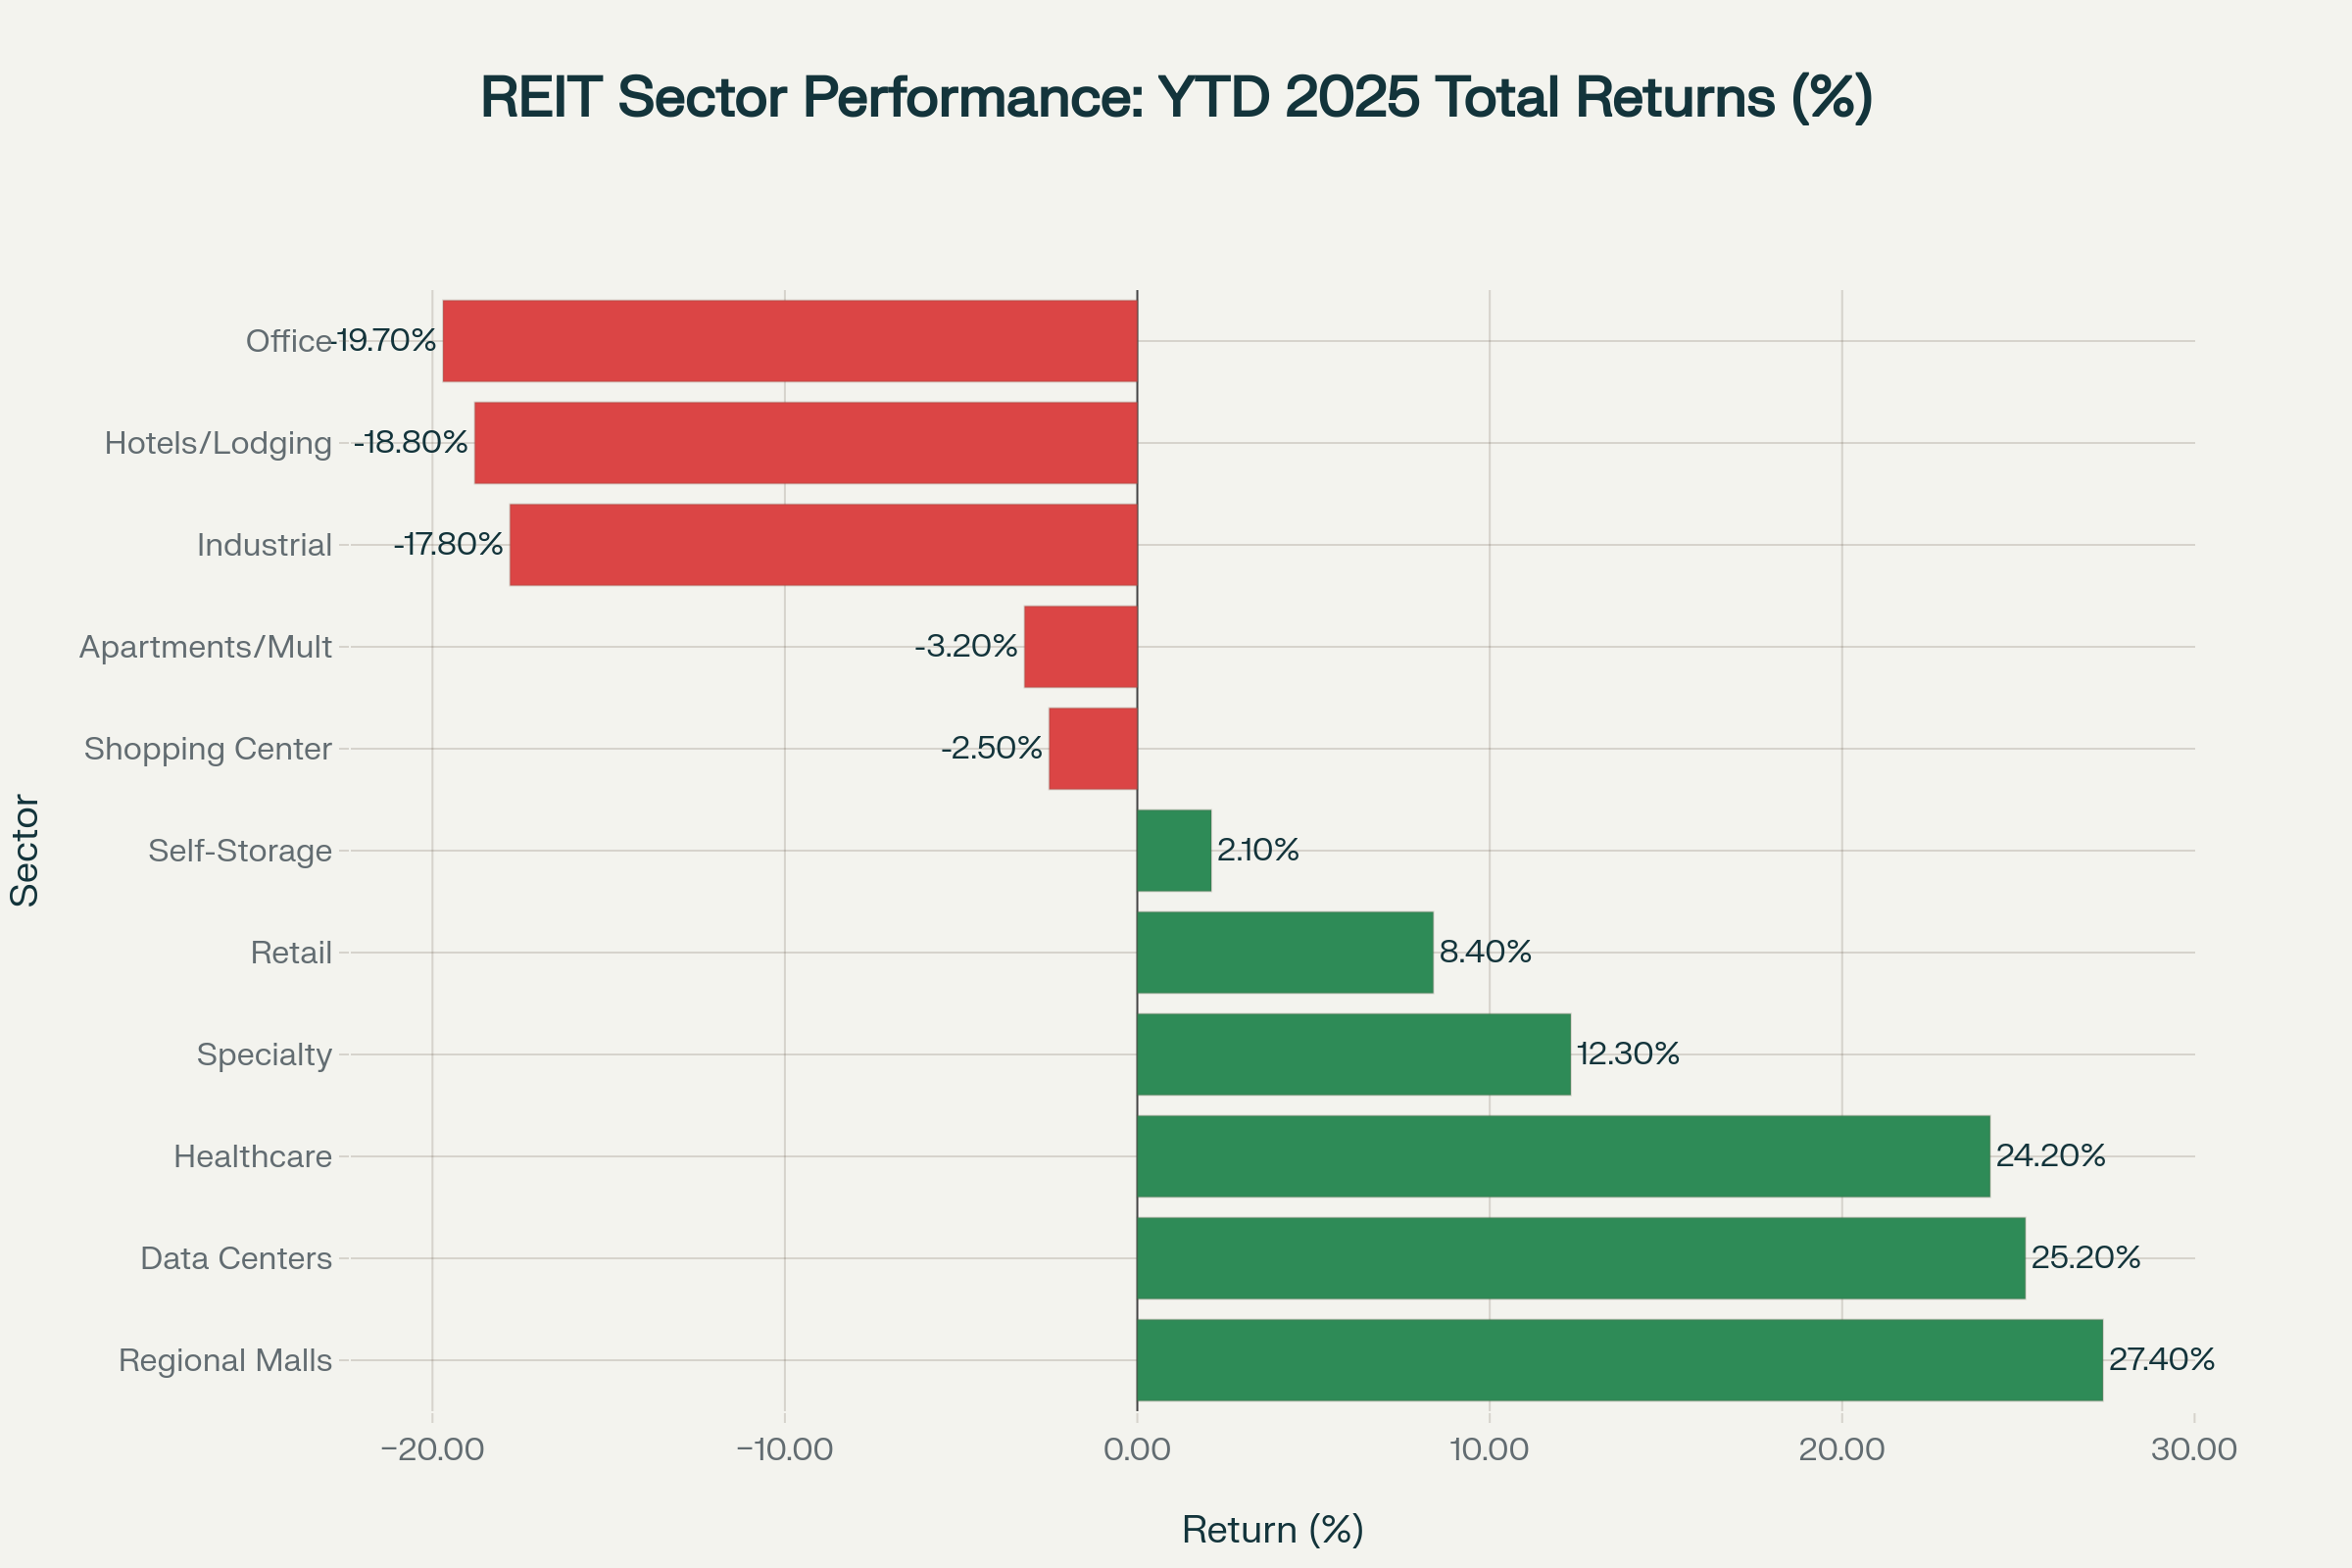 REIT sector performance comparison showing YTD 2025 total returns, with data centers and healthcare leading the recovery
Sector Performance Analysis: Leaders and Laggards
Data Centers: AI-Driven Supercycle Continues
Data center REITs maintained exceptional momentum in Q3 2025, posting the sector’s highest FFO growth at 21.3% year-over-year. The sector’s $185.4 billion market capitalization represents the largest REIT category, reflecting investor confidence in long-term artificial intelligence demand trends.
Digital Realty Trust (DLR) reported Q3 FFO per share of $1.89, representing 18.2% year-over-year growth, while announcing plans to double capacity by 2029. The company’s development pipeline includes 499 MW of additional capacity in the Americas, with 79% already pre-leased. Similarly, Equinix (EQIX) delivered stellar 24.1% FFO growth with plans to spend $4-5 billion annually through 2029, a significant increase from $3.3 billion in 2025.
The sector benefits from multiple structural tailwinds:
- AI computing demand
Hyperscalers like Amazon, Google, and Microsoft continue aggressive expansion. - Power scarcity
Limited grid capacity creates barriers to entry and pricing power. - Global expansion:
International markets are absorbing record capacity, with Europe expecting 937 MW in 2025. - Technology evolution
Shift to liquid cooling infrastructure, enhancing asset values.
However, supply chain disruptions and extended power transmission timelines pose development risks, with some projects facing 4+ year delays for high-capacity power lines.
 Comparison of FFO and NOI growth rates across REIT sectors in Q3 2025, showing operational performance metrics
Healthcare REITs: Capitalizing on Demographic Destiny
Aging Population Drives Exceptional Returns
Healthcare REITs emerged as Q3 2025’s second-best performing sector, delivering 18.0% FFO growth and 24.2% year-to-date returns. The sector’s $78.9 billion market capitalization positions operators to capitalize on America's accelerating demographic shift.
Welltower (WELL) stands out with a remarkable 21.9% year-over-year normalized FFO growth to $1.28 per share. The company's Seniors Housing Operating portfolio posted exceptional 23.4% same-store NOI growth, driven by:
- Occupancy Recovery: 420 basis points of improvement
- Pricing Power: 4.9% Revenue Per Occupied Room growth
- Operational Leverage: AI-driven margin expansion of 330 basis points
Investment Acceleration and Attractive Yields
Healthcare REITs completed $9.2 billion of pro rata investment activity year-to-date, demonstrating capital deployment capabilities. The sector's attractive 4.5% dividend yield, combined with strong fundamentals, creates compelling value for income-focused institutional investors.
Key performance drivers include:
- Senior housing occupancy is improving 300+ basis points annually.
- Revenue growth is significantly outpacing expense increases.
- Demographic tailwinds from baby boomer aging.
- Enhanced operational efficiency through technology adoption.
Industrial REITs: Defensive Characteristics Shine Through
Resilience Despite Supply Chain Headwinds
Industrial REITs posted solid 8.0% FFO growth in Q3 2025 despite facing supply chain uncertainty and elevated construction deliveries. The sector's $142.8 billion market capitalization reflects its defensive characteristics and essential infrastructure nature.
Prologis (PLD), the sector's largest player, reported 10.9% core FFO growth to $1.42 per share. The company signed leases totaling 58 million square feet while expanding power capacity for data center demand, achieving 94.9% average occupancy and 53.7% net effective rent change on new leases.
Long-Term Fundamentals Remain Supportive
Despite near-term challenges, industrial REITs benefit from several structural advantages:
- Limited New Supply
High construction costs constrain the future development pipeline. - Rent Growth Potential
Long-term demographic and e-commerce trends remain intact. - Data Center Crossover
Industrial properties increasingly support AI infrastructure needs. - Fortress Balance Sheets
Strong liquidity positions enable opportunistic acquisitions.
However, rising vacancy rates from 4% in 2022 to 7.0-7.5% by mid-2025 reflect current oversupply pressures that investors should monitor.
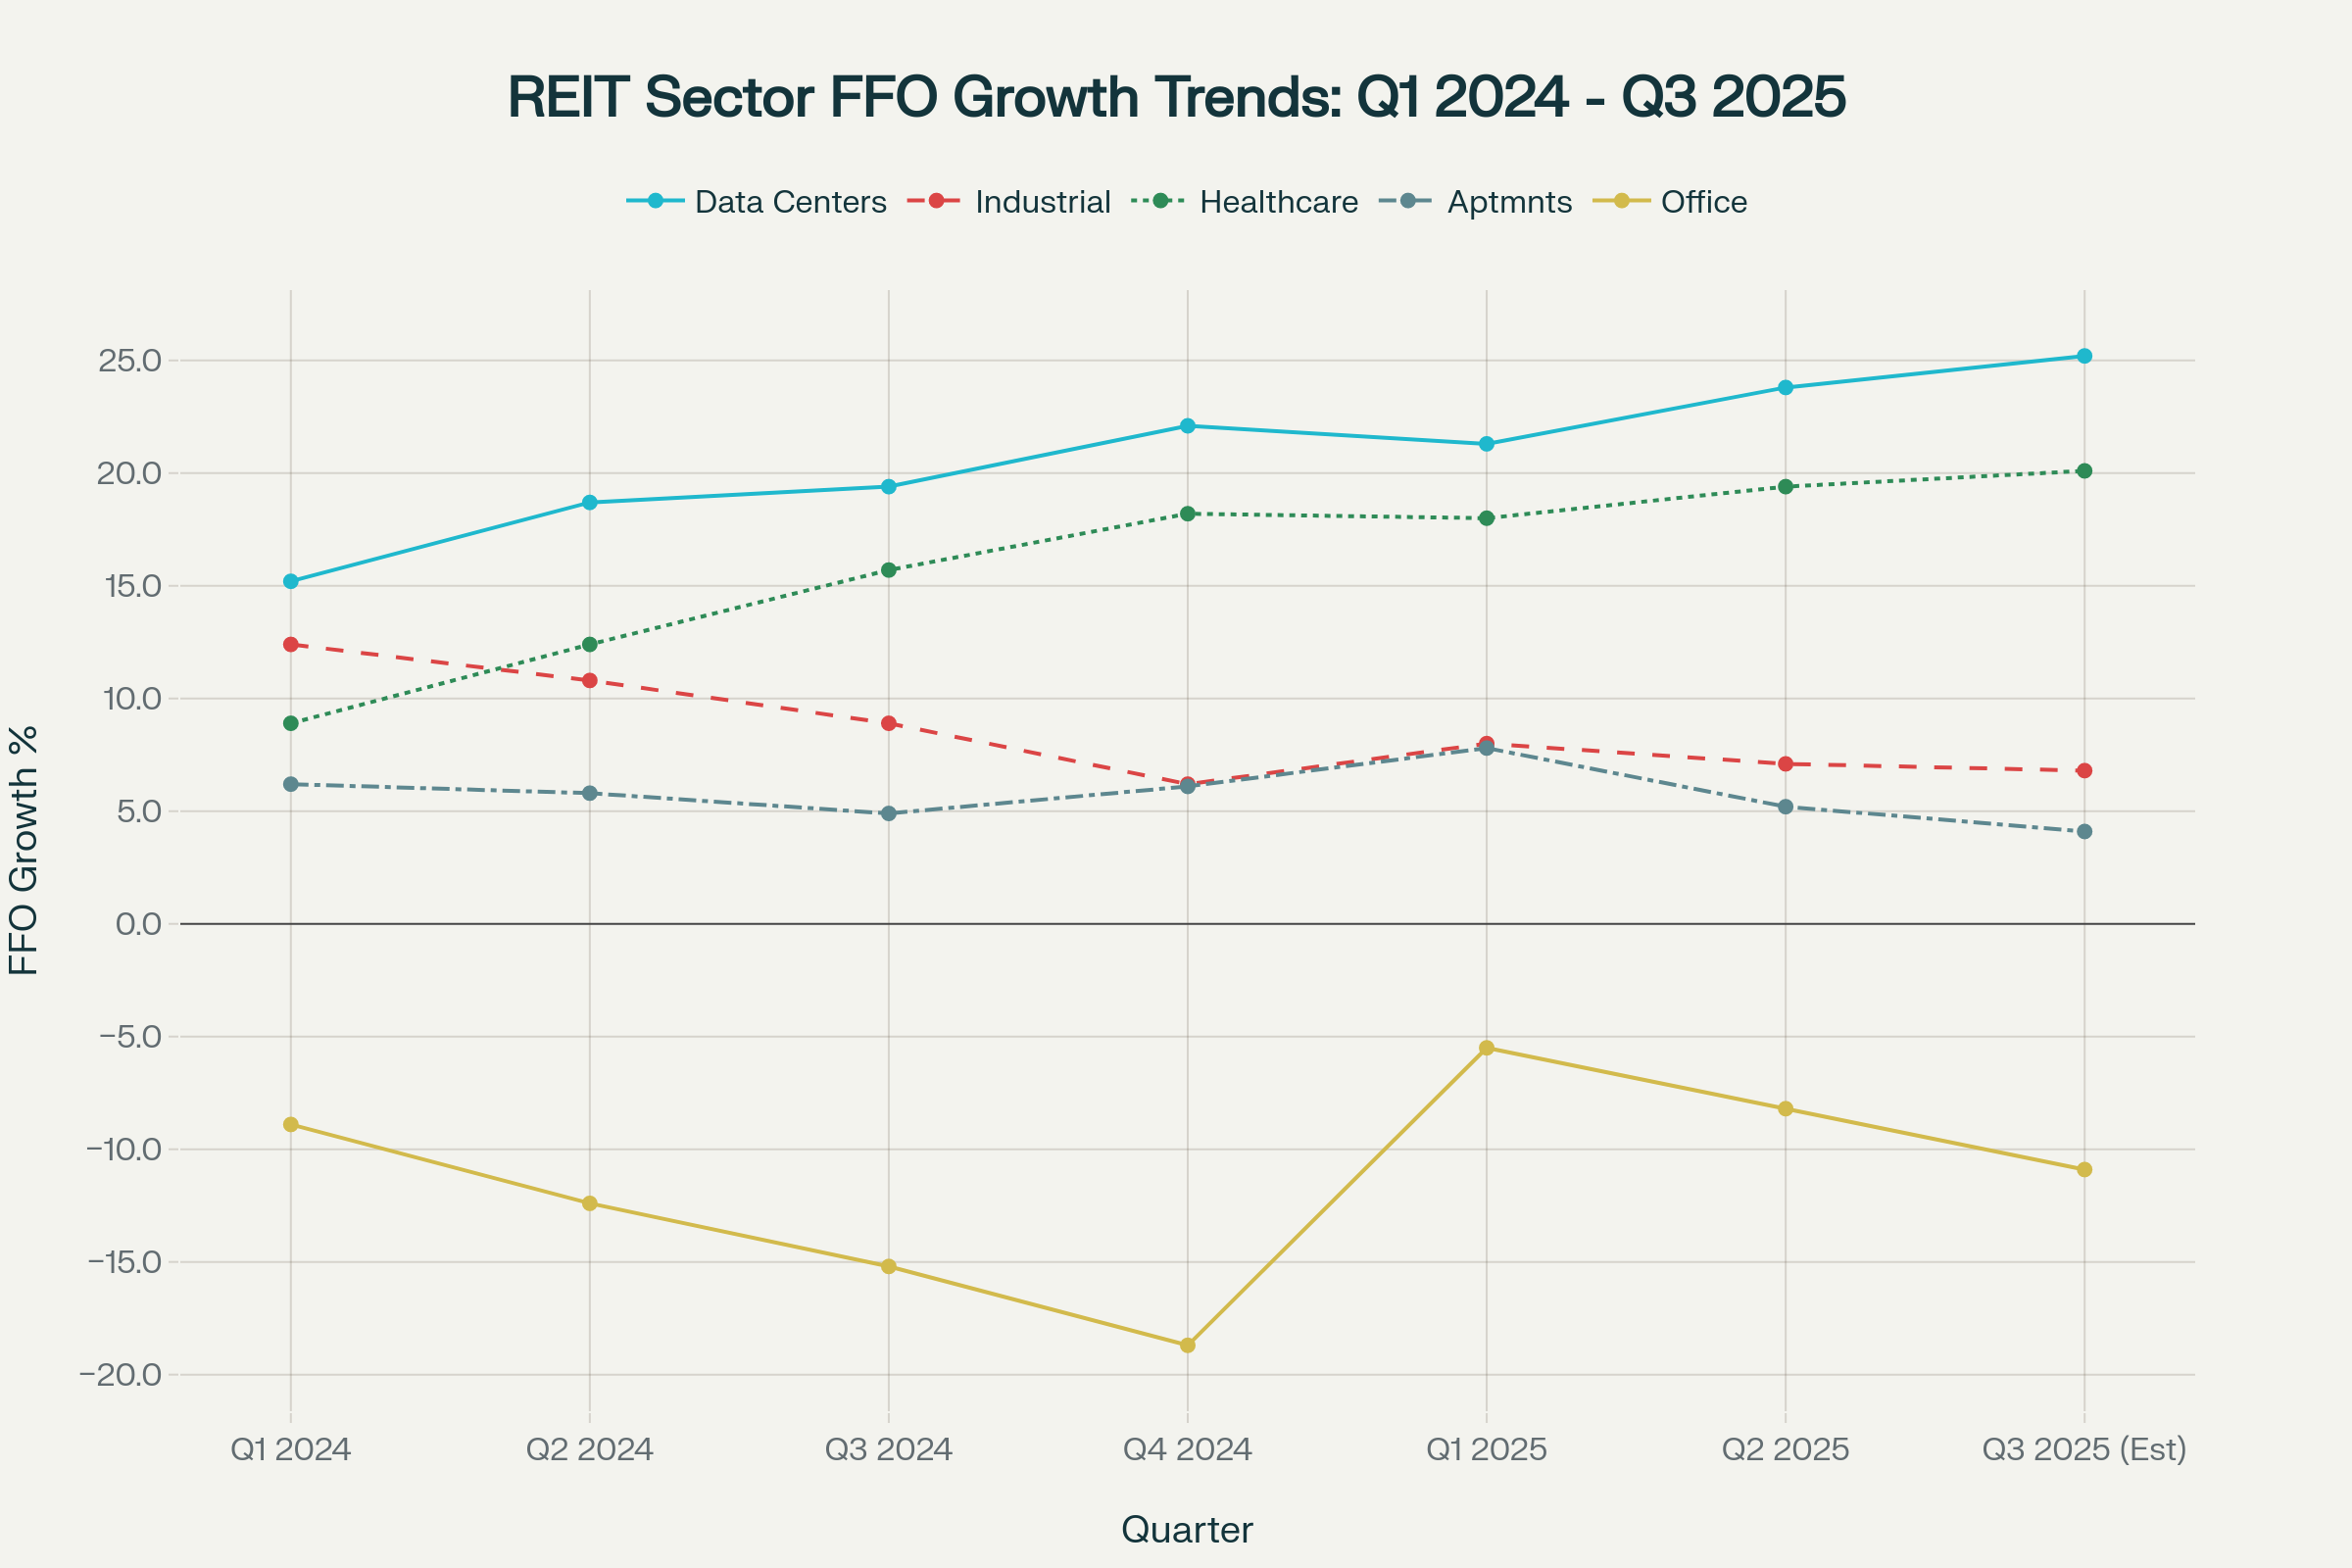 Line chart showing FFO growth trends for major REIT sectors from Q1 2024 through Q3 2025, highlighting divergent performance patterns
Struggling Sectors: Office and Hotels Face Structural Challenges
Office REITs: Persistent Hybrid Work Impact
Office REITs continue struggling with -5.5% FFO growth and -19.7% year-to-date returns through Q3 2025. The sector's reduced $45.2 billion market capitalization reflects deep discounting amid structural demand challenges from hybrid work adoption.
Performance remains bifurcated, with high-quality portfolios in Sunbelt markets delivering 55%+ total shareholder returns, while weaker operators face declining occupancy. Average occupancy of 85.3% significantly lags other property types.
Hotel REITs: Recovery Timeline Uncertain
Hotel REITs posted -18.8% year-to-date returns despite 12.0% Q3 FFO growth. The sector's $28.7 billion market capitalization and 72.4% average occupancy reflect ongoing operational challenges and economic uncertainty.
RLJ Lodging Trust emerged as a bright spot, with analysts forecasting a 13.3% dividend increase to $0.17 per share—the highest projected increase for Q3 2025.
Institutional Investment Trends and Opportunities
Growing Institutional Appetite
Institutional investors increasingly view REITs as essential portfolio components for inflation protection and secular growth exposure. Data from the Nareit Actively Managed Real Estate Fund Tracker shows data centers account for 10.5% of aggregate assets under management, 1.4 percentage points above their index weight.
Key institutional investment drivers:
- Defensive characteristics
More stable earnings compared to broader equity markets. - Income generation
Average 4% dividend yields with growth potential. - Inflation hedging
Real estate’s natural inflation protection. - Diversification benefits
Low correlation with traditional asset classes.
Private Market Dynamics
Private real estate investment performance remained challenging, with closed-end funds posting -1.1% pooled IRR through Q3 2024. However, alternative sectors delivered strong returns, with data centers generating 11.2% returns and manufactured housing achieving 11.7% returns.
This performance disparity between public and private real estate creates opportunities for REITs to capitalize on their cost of capital advantage and operational expertise.
Valuation Analysis and Investment Implications
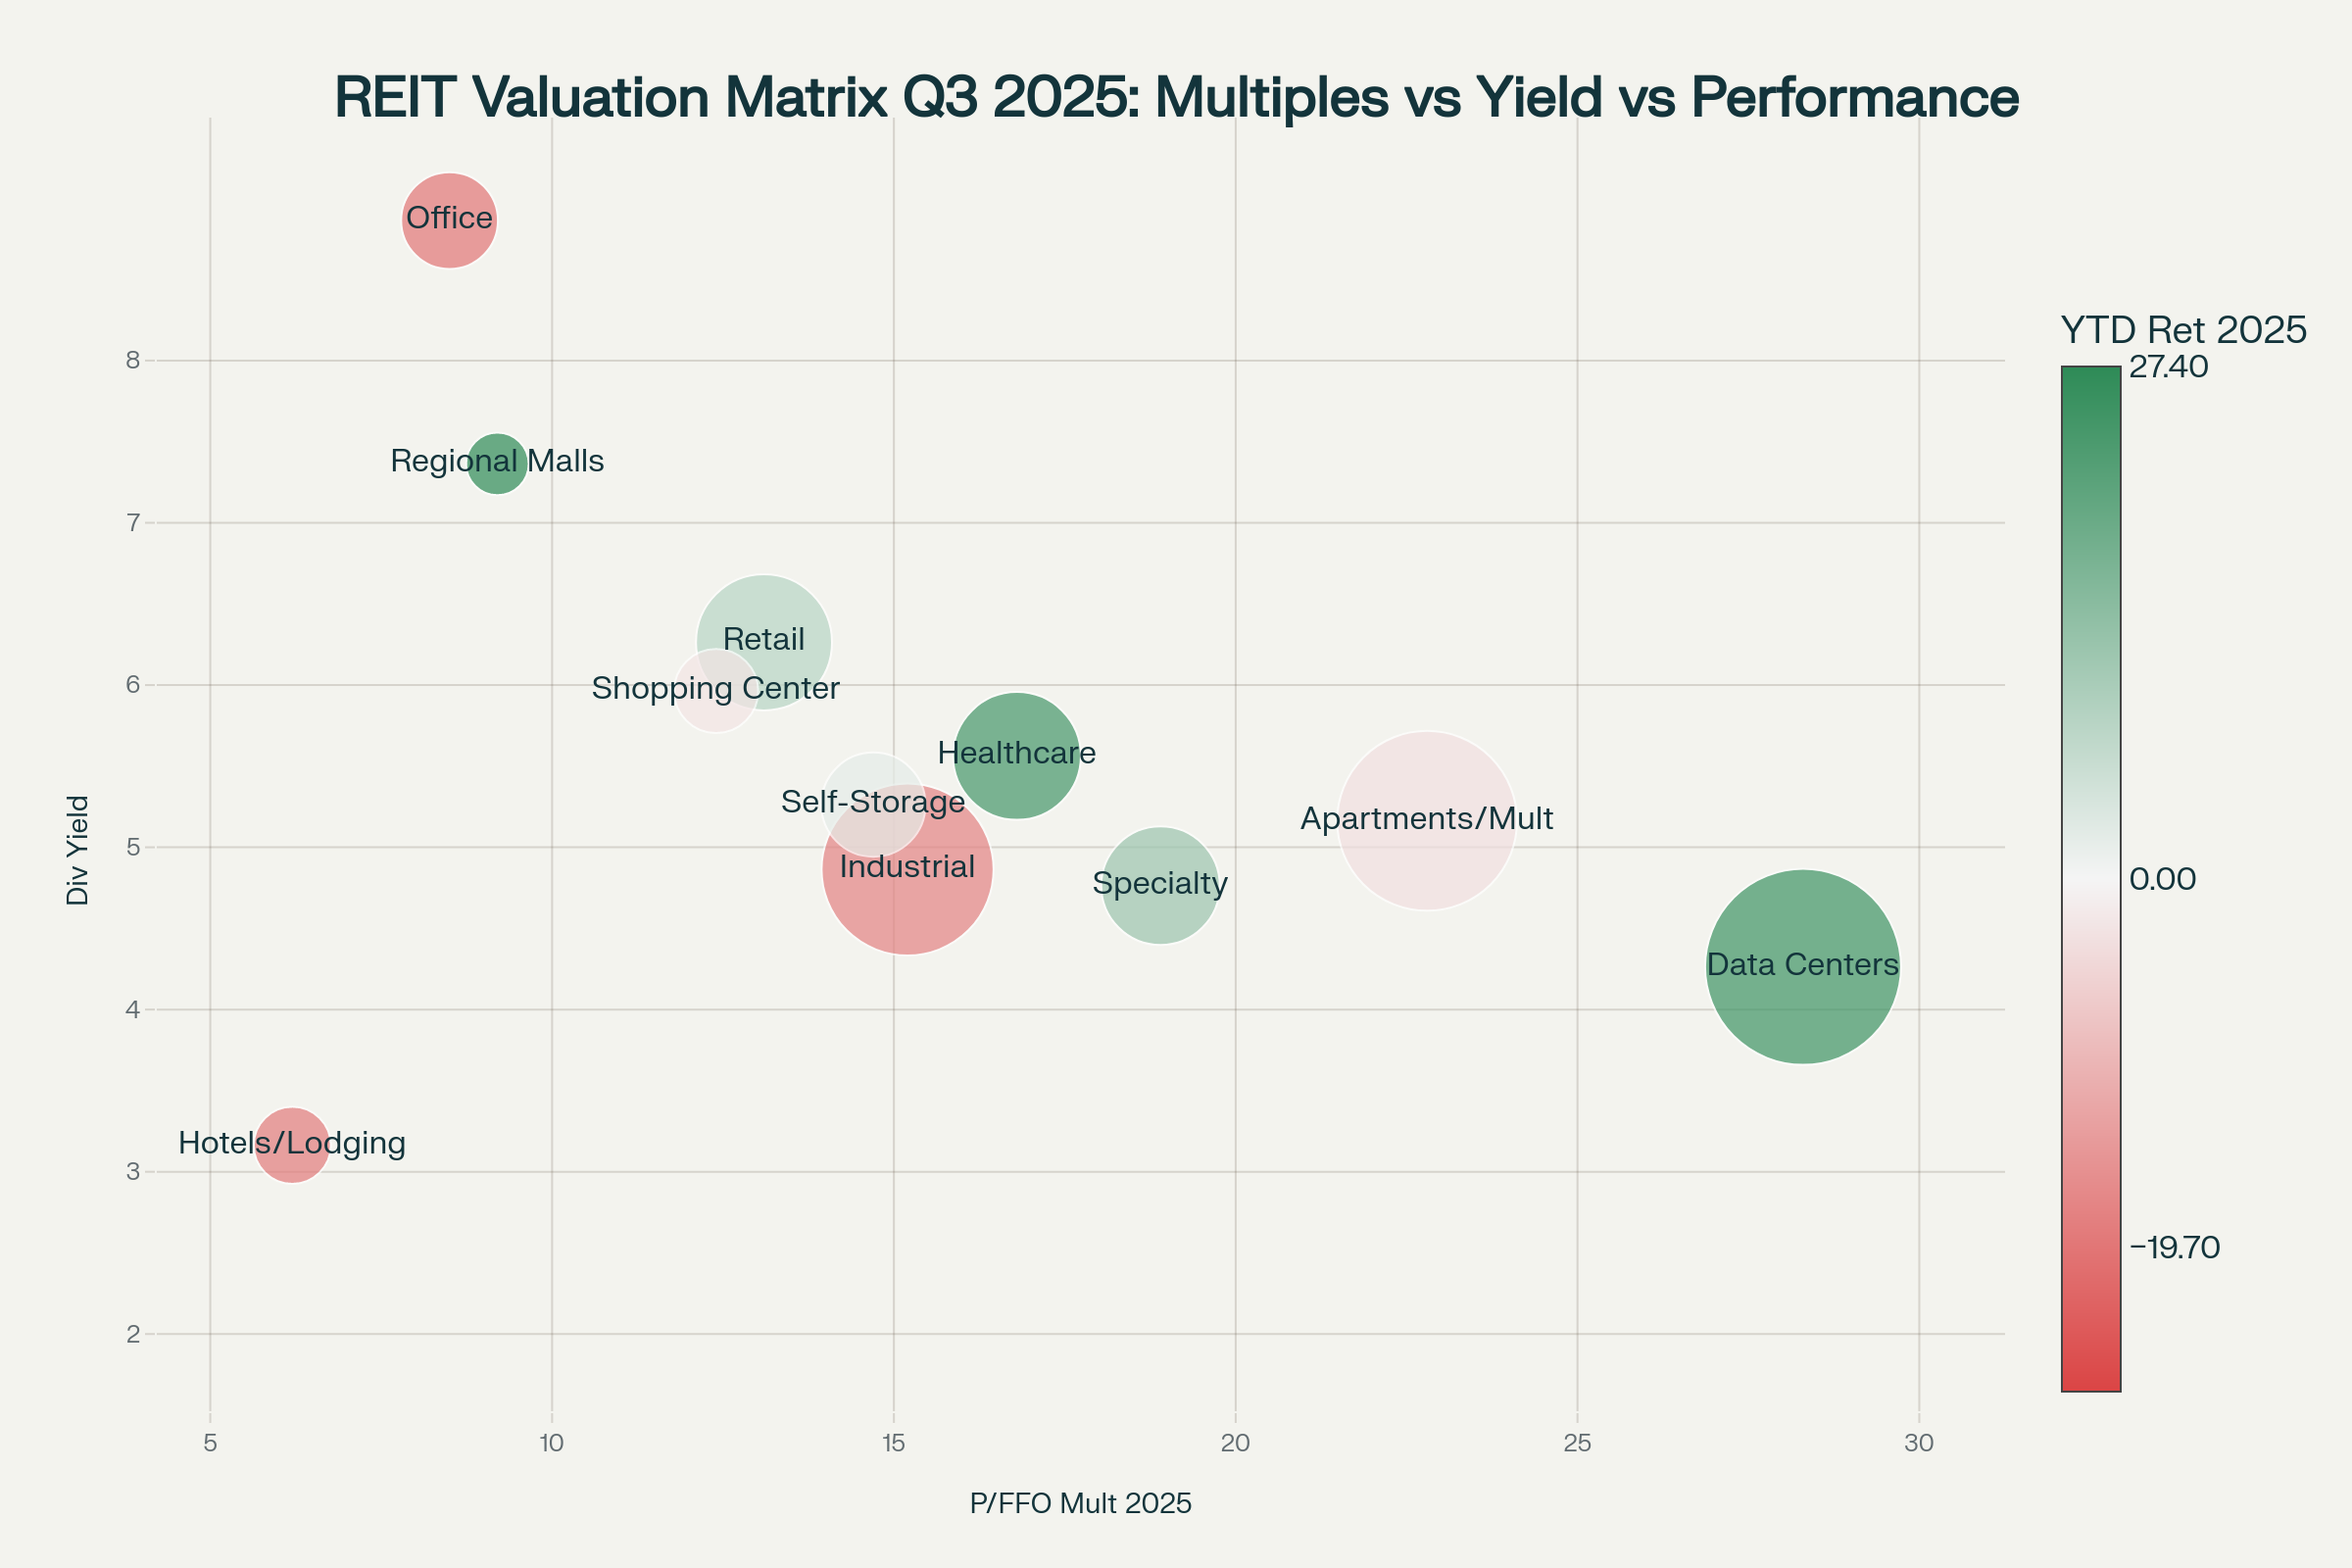 Bubble chart displaying REIT valuation metrics, including P/FFO multiples, dividend yields, market capitalization, and performance returns
Sector Valuation Metrics
REIT valuations present mixed signals across sectors. Data centers trade at a premium 28.3x P/FFO multiples reflecting growth expectations, while office REITs trade at deeply discounted 8.5x multiples due to structural challenges.
Value opportunities exist in:
- Regional malls: Trading at 9.2x P/FFO despite 27.4% YTD returns
- Hotels: 6.2x P/FFO multiples with potential cyclical recovery
- Self-storage: 14.7x multiples with steady 6.5% FFO growth
Premium valuations appear justified for:
- Data centers: 28.3x P/FFO supported by 21.3% growth and secular trends
- Apartments: 22.8x multiples reflecting defensive characteristics
- Specialty REITs: 18.9x multiples driven by niche market positions
Dividend Sustainability and Growth
Eighteen REITs are forecast to increase dividends in Q3 2025, signaling management confidence in earnings sustainability. Notable increases include:
- RLJ Lodging Trust: 13.3% increase to $0.17 per share
- Alexander & Baldwin: 11.1% increase to $0.25 per share
- Welltower: 9.0% increase to $0.73 per share
- Digital Realty Trust: 4.1% increase to $1.27 per share
Approximately 75.8% of US REITs are expected to maintain regular cash dividends during Q3 2025, demonstrating sector-wide financial stability.
Investment Strategy and Market Outlook
Dividend Growth Signals Management Confidence
Eighteen REITs are forecast to increase dividends in Q3 2025, signaling management confidence in earnings sustainability. Notable increases include:
- RLJ Lodging Trust: 13.3% increase to $0.17 per share
- Alexander & Baldwin: 11.1% increase to $0.25 per share
- Welltower: 9.0% increase to $0.73 per share
- Digital Realty Trust: 4.1% increase to $1.27 per share
Approximately 75.8% of US REITs are expected to maintain regular cash dividends during Q3 2025, demonstrating sector-wide financial stability.
Sector Allocation Recommendations
Overweight Positions:
- Data Centers: Sustained AI demand and power scarcity create durable competitive advantages
- Industrial: Defensive characteristics with long-term secular growth potential
- Healthcare: Demographic tailwinds and operational improvements drive consistent outperformance
Underweight Positions:
- Office: Structural headwinds from hybrid work adoption
- Hotels: Cyclical recovery uncertain amid economic volatility
2026 Outlook: Constructive but Selective
J.P. Morgan Research projects 3% FFO growth for 2025, accelerating to 6% in 2026 as transaction markets normalize. Combined with 4% dividend yields and valuation expansion potential, this suggests approximately 10% total returns for well-selected REIT investments.
Key catalysts supporting continued outperformance include:
- Federal Reserve policy tailwinds are reducing financing costs.
- The transaction market recovery is improving liquidity for external growth.
- More stable FFO growth compared to broader equity markets.
- Capital allocation opportunities from distressed situations.
Risk Considerations for Investors
While the REIT sector outlook appears constructive, several risks require monitoring:
- Interest Rate Sensitivity
10-year Treasury yields remain the primary performance driver for REITs. - Economic Slowdown
A potential recession could impact occupancy rates and rent growth across sectors. - Supply Pressures
Elevated construction in some sectors is creating near-term headwinds. - Geopolitical Uncertainty
Trade policies may affect international operations and supply chains.
Conclusion: Active Sector Selection Critical
REIT sector performance in Q3 2025 validates the importance of active sector selection in an increasingly bifurcated market. Data centers and healthcare REITs demonstrate that secular growth themes can drive exceptional returns even in challenging macro environments, while traditional sectors face ongoing structural adaptation.
For institutional and individual investors alike, REITs offer compelling value propositions: defensive earnings characteristics, attractive dividend yields, inflation protection, and exposure to transformative trends like artificial intelligence and demographic aging.
The sector’s evolution toward more defensive, growth-oriented property types reduces cyclical sensitivity while maintaining real estate's core benefits. Investment success will increasingly depend on identifying REITs with sustainable competitive advantages, whether through irreplaceable assets, demographic exposure, or operational excellence.
Ready to Optimize Your Investment Portfolio?
Understanding REIT sector dynamics is crucial for building a resilient, income-generating portfolio. At Paperfree.com, we provide institutional-quality research and analysis to help you navigate complex investment landscapes.
Discover how our comprehensive market insights can enhance your investment strategy:
- Access detailed sector performance analysis.
- Get expert portfolio allocation recommendations.
- Stay ahead of market trends with real-time updates.
- Connect with investment professionals for personalized guidance.

Pages Related to #REIT sector performance Q3 2025
- Hard Money Lending VS Real Estate Crowdfunding

- How to Spot and Avoid Hard Money Scams

- Hard Money Jumbo Loans in 2025: Latest CFPB Updates & Analysis

- Are REITs safe investment? REIT risks explained. Mortgage REIT risks.

- The Comparison of REITS, Real Estate Funds and Real Estate Mutual Funds.

- [closed] CMF. Cedar Multifamily Fund
![[closed] CMF. Cedar Multifamily Fund](https://d2sv4n3pfes7l9.cloudfront.net/file_paperfree_144_2020-8-21-19-57-p_pf-avatar.jpg)
- The great wealth transfer

- Value add real estate funds for capital growth | Paperfree.com

Popular Page
Private Real Estate Funds - Investments to Drive Income and Capital Growth
Book a Free Complimentary Call
real estate investing Investment Visa USA Investment Magazine Private Real Estate Funds real estate funds