Private Equity Operational Alpha in 2026: The Future of Value Creation
How leading PE teams are turning execution into returns in a higher-rate, data-driven market.last updated Tuesday, July 21, 2026
#Operational Alpha #Operational Alpha 2025
| | by Sidra Jabeen | Content Manager, Paperfree Magazine |

QUICK LINKS
AD
Get Access to Real Estate Investment Opportunities
What is Operational Alpha 2026: Basic Concept
- Definition: Systematic improvement of business operations to create measurable value.
- Focus: Revenue growth, margin expansion, and cash flow optimization.
- Approach: Data-driven operational changes vs. financial engineering.
- Higher interest rates have rendered cheap debt strategies ineffective.
- Revenue growth now drives 54-71% of PE value creation.
- Extended holding periods require sustainable improvements.
- Commercial excellence: Better pricing and sales processes.
- Cost optimization: Smarter procurement and operations.
- Working capital: Faster cash conversion.
- Digital tools: AI and automation for efficiency.
- 2-18% EBITDA improvement potential.
- 3-24-month payback periods.
- Sustainable competitive advantages.
- Exit-ready businesses command premium valuations.
Private equity is emerging from its most challenging period since the global financial crisis with a clear mandate: operational excellence has become the primary driver of value creation. Global PE deal value rebounded 14% to $2.0 trillion in 2024, marking the third-highest year on record, while exit activity surged 34% to $468 billion. However, with 18,000+ companies held for more than four years and $3.6 trillion in unrealized value across 29,000 unsold companies, the industry faces an unprecedented backlog of exits.
In this higher-rate environment, the era of financial engineering is over. Revenue growth now accounts for 54-71% of total value creation at exit, up from historical averages, while multiple expansion has declined significantly. Over 70% of PE firms now cite operational improvements as their primary lever for value creation, a fundamental shift from the leverage-driven playbooks of the past.
The math is compelling: top-quartile operational improvements can deliver 5-18% EBITDA uplift with payback periods as short as 3-9 months for working capital initiatives and 6-12 months for commercial excellence programs.
| Lever | EBITDA Uplift Range | Typical Payback (Months) | Prerequisites | Key KPIs |
|---|---|---|---|---|
| Commercial Excellence & Pricing | 5–15% | 6–12 | Pricing data, segment analysis, and competitive benchmarks | Gross margin uplift, net revenue retention, and win rate |
| Procurement & Cost-to-Serve | 3–8% | 6–18 | Spend analysis, supplier data, category management | PPV savings, OTIF rates, and distribution cost per order |
| Working Capital Release | 2–5% | 3–9 | A/R, A/P, inventory aging, payment terms analysis | CCC reduction, DSO/DPO/DIO improvements |
| Digital & AI Productivity | 4–12% | 12–24 | Clean data, change management, and technical infrastructure | Process automation rate, employee productivity |
| Sales Operating System | 6–18% | 9–18 | CRM hygiene, territory analysis, process standardization | Pipeline coverage, conversion rates, sales velocity |
| Manufacturing & Supply Chain | 4–10% | 12–24 | S&OP discipline, capacity analysis, quality systems | OEE improvement, yield rates, and schedule adherence |
| Product & Mix Optimization | 3–12% | 6–15 | Contribution margin by SKU, customer profitability | Revenue per product, margin mix improvement |
| G&A Modernization | 2–6% | 9–18 | Process mapping, shared services design, ERP readiness | Cost-to-serve reduction, processing time improvement |
This operational alpha represents the most accessible path to market-beating returns in an environment where cheap debt and multiple arbitrage no longer provide reliable value creation.
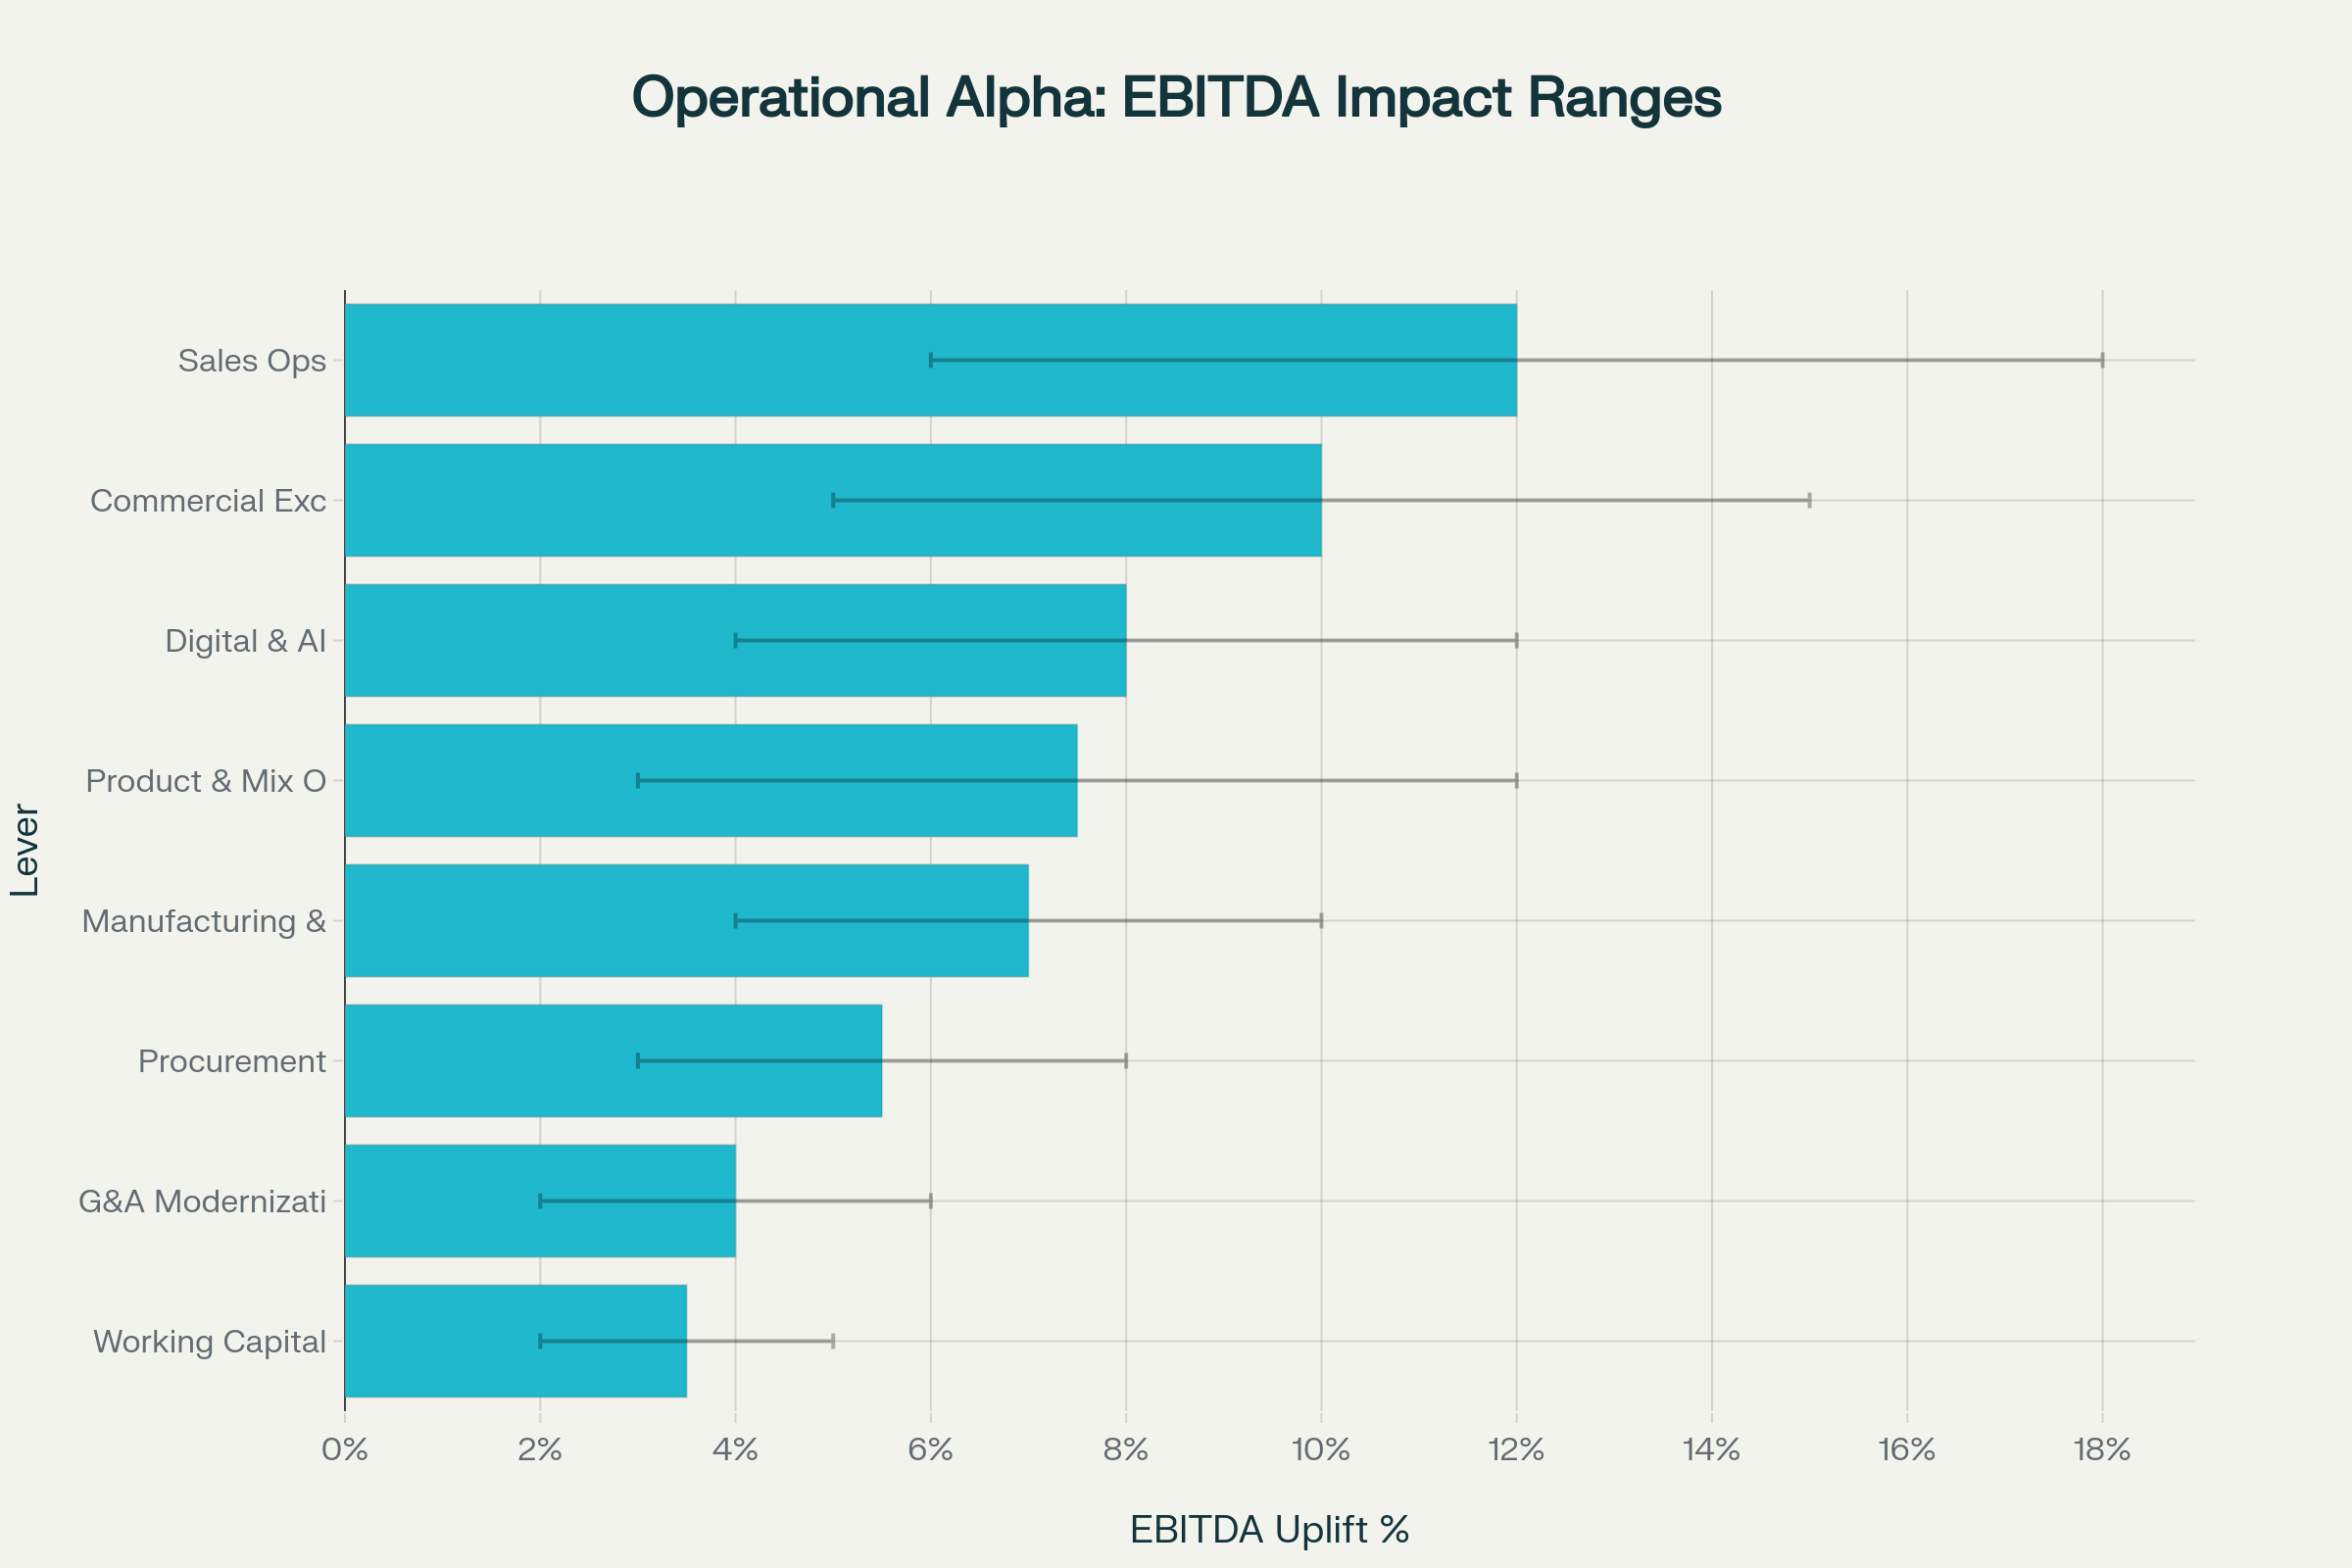 EBITDA uplift ranges by operational lever, showing revenue-focused initiatives deliver the highest impact
Defining "operational alpha" in 2025
Operational alpha 2025 in private equity represents the systematic application of operating levers that drive measurable improvements in EBITDA, cash conversion, and business resilience—distinct from reliance on multiple expansion or financial engineering. It encompasses the disciplined execution of commercial, operational, and organizational initiatives that create sustainable competitive advantages and prepare companies for premium exits.
Recent survey evidence highlights the importance of leadership and talent in achieving operational success. AlixPartners' 10th Annual PE Leadership Survey reveals a striking disconnect between PE firms and portfolio companies: 41% of PE executives identify senior leadership quality as a significant challenge, compared to just 13% of portfolio leaders. This perception gap directly impacts execution, with 51% of PE leaders citing financial performance tensions around meeting targets on tight timelines.
The survey data highlights why people-centric operational strategies have become critical. While PE firms prioritize AI for operational efficiency, portfolio companies favor growth-related AI applications in sales, marketing, and customer insights by nearly two-to-one. This misalignment suggests that successful operational alpha requires not only the right levers but also the right change management approach to ensure organizational buy-in.
Modern operational alpha differs fundamentally from traditional cost-cutting. It focuses on revenue growth engines, margin optimization through commercial excellence, and cash conversion acceleration—all while building organizational capabilities that compound value over extended holding periods averaging 6.7 years.
The 100-day plan that actually works
30-60-90 deliverables
The most successful PE firms follow a disciplined 100-day framework that balances quick wins with foundational value creation infrastructure. This approach has become essential as firms face pressure to demonstrate progress early while building sustainable improvements.
| Phase | Key Deliverables | Success Metrics | Owner |
|---|---|---|---|
| 0–30 Days | Data baseline, KPI tree setup, cash & service level triage, pricing guardrails | Financial data validated, priority opportunities identified, quick wins launched | Investment team + portfolio CEO |
| 31–60 Days | Quick wins execution (pricing, freight, SKU rationalization), PMO setup, change cadence | 2–3 quick wins delivering results, weekly value committee established | Operating partners + management team |
| 61–100 Days | Scale pilots, finalize 3-year value plan, align incentive comp and governance | Full value creation plan approved, management incentives aligned, and quarterly board rhythm | Full leadership team + board |
0–30 days: Foundation and triage
The initial month focuses on establishing data integrity, identifying immediate cash and service level risks, and implementing pricing guardrails to prevent value leakage. Investment teams work directly with portfolio CEOs to validate financial baselines, create comprehensive KPI trees that link operational metrics to value creation, and launch 2-3 high-confidence, quick wins. Success metrics include financial data validation, identifying priority opportunities, and deploying initial quick wins.
31–60 days: Quick wins and infrastructure
Month two focuses on scaling quick wins in pricing optimization, freight cost reduction, and SKU rationalization, while establishing the project management office (PMO) and setting up a weekly value committee cadence. Operating partners collaborate with management teams to implement standardized reporting, refine operational processes, and initiate medium-term pilot programs. The target is to deliver measurable results from 2-3 quick wins and establish sustainable governance rhythms.
61–100 days: Strategy and alignment
The final month consolidates pilot results into a comprehensive 3-year value creation plan, aligns management incentive compensation with value drivers, and establishes quarterly board value review processes. The full leadership team and board collaborate to finalize strategic priorities, establish performance metrics, and establish accountability structures. Success requires board approval of the complete value creation roadmap and alignment of all stakeholder incentives.
This phased approach addresses the most common failure points in PE operational initiatives: inadequate data foundation, lack of change management discipline, and misaligned incentives between sponsors and management teams.
Eight operating playbooks with ROI benchmarks
Commercial excellence and pricing
Micro-segmented pricing strategies and discount governance represent the highest-impact operational lever, delivering 5-15% EBITDA uplift with 6-12 month payback periods. Best-in-class approaches include customer micro-segmentation analysis, elasticity modeling for key product categories, and systematic discount approval workflows that capture pricing discipline at the point of sale.
Implementation requires consolidating pricing data, conducting competitive benchmarking across segments, and scoring churn risk to balance aggressive pricing with customer retention. Key performance indicators include gross margin uplift, net revenue retention rates, and sales win rates across pricing tiers. The prerequisite foundation includes clean transaction data, segment profitability analysis, and competitive positioning benchmarks.
Procurement and cost to serve
Strategic procurement optimization typically yields 3-8% EBITDA improvement through should-cost modeling, vendor consolidation, and freight optimization within 6-18 months. The most effective programs move beyond simple vendor negotiations to comprehensive total cost of ownership analysis, including quality metrics, delivery performance, and supply chain risk factors.
Successful implementation focuses on category management, supplier scorecarding, and freight lane optimization. Critical KPIs include purchase price variance (PPV) savings, on-time-in-full (OTIF) delivery rates, distribution costs per order, and supplier defect rates. Prerequisites include comprehensive spend analysis, supplier performance data, and category management capabilities.
Working capital release
Working capital optimization delivers 2-5% EBITDA impact through accelerated cash conversion, typically within 3-9 months. AlixPartners' research shows that working capital is one of the most immediate liquidity sources in portfolio companies, yet sponsors often prioritize revenue growth initiatives over it.
Effective programs harmonize payment terms, optimize inventory levels through demand planning, and reduce days sales outstanding through collections process improvement. Key metrics include cash conversion cycle reduction, improvements in DSO/DPO/DIO ratios, and overall cash conversion enhancement. The foundation requires detailed analysis of accounts receivable aging, accounts payable terms, inventory turnover by SKU, and payment term benchmarking.
Digital and AI productivity
Technology-enabled productivity improvements deliver 4-12% EBITDA uplift with 12-24 month payback periods, focusing on demand forecasting, lead scoring, pricing elasticity analysis, and customer service automation. Private equity firms report that nearly 20% of portfolio companies have operationalized generative AI use cases with measurable results, while a majority are in various testing and development phases.
Realistic adoption paths prioritize use cases with clean data requirements and clear ROI measurement. Successful applications include sales productivity tools, customer service chatbots, demand planning optimization, and pricing recommendation engines. Prerequisites include data infrastructure readiness, change management capabilities, and technical integration planning.
Sales operating system
Sales system optimization generates 6-18% EBITDA improvements through territory design, pipeline hygiene, qualification methodology implementation (such as MEDDICC), and management cadence standardization within 9-18 months. The broad range reflects the varying baseline performance across portfolio companies.
Implementation focuses on CRM data quality, territory optimization based on potential and coverage, and sales process standardization. Critical performance indicators include pipeline coverage ratios, stage-to-stage conversion rates, and overall sales velocity improvements. Prerequisites include CRM system hygiene, territory analysis capabilities, and sales process standardization frameworks.
Manufacturing and supply chain resilience
Operations excellence delivers 4-10% EBITDA improvement through sales and operations planning (S&OP) discipline, throughput optimization, quality assurance enhancement, dual-sourcing strategies, and manufacturing footprint optimization within 12-24 months. These initiatives have become particularly critical given supply chain disruptions and the need for resilient operations.
Key performance indicators include overall equipment effectiveness (OEE) improvement, yield rate enhancement, schedule adherence metrics, and backlog days reduction. Prerequisites include S&OP process discipline, capacity analysis capabilities, quality systems, and supply chain mapping.
Product and mix optimization
Product portfolio optimization yields 3-12% EBITDA uplift through contribution margin analysis by SKU, strategic product rationalization ("kill lists"), attachment strategy development, and packaging optimization within 6-15 months. The wide range reflects the varying complexity of product portfolios across industries.
Successful programs require detailed contribution margin analysis by product line, customer profitability assessment, and strategic product lifecycle management. Success metrics focus on revenue per product improvement and overall margin mix enhancement.
G&A modernization
General and administrative cost optimization delivers 2-6% EBITDA improvement through finance and HR shared services implementation, cloud ERP migrations, and cost-to-serve automation within 9-18 months. While offering lower absolute impact, G&A optimization often provides the foundation for scaling other operational improvements.
Implementation requires comprehensive process mapping, shared services design, and ERP modernization planning. Key performance indicators include cost-to-serve reduction and processing time improvements across finance, HR, and administrative functions.
Carve-outs and complex deals: where ops creates outsized alpha
Carve-out transactions represent a compelling operational alpha opportunity, with deal activity reaching 10.6% of all US PE buyouts in 2025—well above the five-year average of 8.7%. However, performance has been mixed, with top-quartile carve-outs delivering 2.5x MOIC while average deals since 2012 have generated only 1.5x MOIC, below overall buyout averages.
The performance differential stems from operational execution capabilities. Pre-2012 carve-outs increased enterprise value by boosting revenue and margins by 31% and 29% respectively, while post-2012 deals have achieved only 17% revenue growth and 2% margin improvement. This decline occurs as competition has intensified and sale multiples have increased, creating razor-thin margins for error.
Successful carve-out operations require a systematic approach to transition service agreement (TSA) exits within 12 months, stranded cost removal, and Day-1 operational readiness. The most effective sponsors establish dedicated "control towers" that manage business entanglement complexity, talent gaps, G&A disaggregation, and vendor/client contract migration.
Modern carve-outs benefit from accelerated TSA exit strategies that prioritize operational independence over extended transition periods. Best practices include establishing a standalone IT infrastructure, implementing independent vendor relationships, and building autonomous operational capabilities from day one rather than relying on extended parent company support.
Bolt-on M&A as an Operating Lever
Programmatic bolt-on acquisitions have become central to PE value creation, with buy-and-build strategies delivering higher returns across all performance quartiles. The most successful programs combine strategic acquisitions with operational integration capabilities to achieve revenue growth, margin expansion, and multiple expansion simultaneously.
Effective bolt-on programs require systematic target identification, rapid integration of playbooks, and synergy capture discipline within defined timeframes. Integration value tracking should encompass revenue synergies through cross-selling and market expansion, cost synergies through shared services and procurement scale, and operational synergies through best practice transfer and system integration.
The operational discipline extends to post-integration optimization, where acquired companies benefit from the platform's operational improvements in pricing, procurement, working capital management, and commercial excellence. This creates compounding value as each acquisition benefits from the platform's evolving operational capabilities.
Talent, Incentives, and the Operating Rhythm
Leadership effectiveness has emerged as the strongest lever for value creation in private equity, according to AlixPartners' decade of research. The 2025 leadership survey reveals that PE firms investing in structured leadership assessments, shared performance roadmaps, and continuous learning and development programs significantly outperform those treating talent as a support function.
Effective operating rhythms center on weekly operational dashboards, monthly value committee reviews, and quarterly board value assessments. The weekly cadence focuses on KPI performance, initiative progress, and obstacle resolution. Monthly value committees address strategic priorities, resource allocation, and cross-functional coordination. Quarterly board reviews evaluate overall value creation progress, strategic direction adjustments, and exit preparation milestones.
Incentive alignment requires linking management compensation to specific operational improvements rather than general financial performance. The most effective structures tie 40-60% of management incentives to operational KPIs such as customer retention, productivity metrics, working capital improvement, and commercial excellence measures that directly drive sustainable value creation.
Measuring Operational Alpha: Metrics That Matter
EBITDA Bridge with Operating Drivers
Operational value tracking requires systematic EBITDA bridge analysis that decomposes performance improvements across pricing optimization, product mix enhancement, volume growth, procurement savings, productivity gains, SG&A efficiency, and working capital conversion. This granular approach enables precise attribution of value creation to specific operational initiatives and informs resource allocation decisions.
Best-practice measurement systems link operational KPIs to financial outcomes through clearly defined value drivers. For example, customer retention improvements directly impact revenue stability, pricing discipline drives margin expansion, and working capital optimization accelerates cash conversion. This connection ensures that operational metrics translate to measurable value creation.
Cash and Exit Readiness
Exit preparation metrics focus on cash conversion quality, earnings sustainability, revenue predictability, and operational scalability. Critical indicators include cash conversion rates above 85%, recurring revenue share enhancement, customer concentration reduction below 20% for top customers, and net promoter scores demonstrating customer loyalty and growth potential.
Quality of earnings assessments increasingly emphasize operational sustainability over short-term financial engineering. Acquirers prioritize businesses demonstrating consistent operational improvement, customer satisfaction growth, market share expansion, and competitive moat development through operational excellence rather than financial optimization alone.
The 2025 Market Context: Where Ops Meets Timing
Exit activity reached multi-year highs in the first half of 2025, with annualized projections suggesting PE exits will outpace 2024 levels by 69.3% (excluding extraordinary transactions). This recovery creates a compelling timing for operationally optimized portfolio companies, as buyers increasingly prioritize businesses that demonstrate sustainable operational improvements over financially engineered returns.
The improving exit environment particularly benefits companies with demonstrated operational alpha, as strategic acquirers and secondary sponsors pay premium multiples for businesses with proven revenue growth engines, margin expansion capabilities, and cash conversion excellence. Being exit-ready six quarters in advance of anticipated sale processes allows sufficient time to demonstrate sustainable operational improvements rather than short-term financial optimization.
Regional dynamics add complexity and opportunity. Japan's M&A activity reached a record $232 billion in the first half of 2025, driven by governance reforms and private equity activity. Take-private deals in Japan are expected to exceed $40 billion in 2025, creating opportunities for operational improvement in traditionally undervalued public companies.
Putting It Together: A Practical Blueprint
Successful operational alpha implementation requires systematic 12-month planning with defined milestones and board gates. The blueprint begins with a comprehensive operational assessment during the first 100 days, followed by pilot program implementation and scaling through months 4-8, and culminates with full operational transformation and exit preparation in months 9-12.
Critical success factors include data-driven decision making, change management discipline, performance measurement rigor, and stakeholder alignment maintenance. The most effective programs balance quick wins that demonstrate early progress with foundational improvements that create sustainable competitive advantages.
Toolkit development should encompass KPI dictionaries linking operational metrics to value creation, standardized 100-day planning templates, pricing optimisation playbooks, and cost-to-serve analytical models. These resources enable consistent execution across portfolio companies while allowing customisation for industry-specific requirements and company-specific opportunities.
Risks, Constraints, and What to Avoid
Standard failure modes include resistance to change, inadequate data quality, over-customisation of solutions, technology implementation without adoption planning, and under-resourced project management offices. Organisations frequently underestimate the change management requirements for operational transformation and over-engineer solutions that create complexity rather than value.
Five red flags at 30 days include: a lack of clean baseline data, the absence of leadership alignment on priorities, inadequate project management resources, a technology focus without process discipline, and metrics that don't link to value creation. Early identification and correction of these issues prevent larger program failures and ensure sustainable operational improvements.
The most critical constraint is organizational capacity for change. Successful programs sequence initiatives to avoid overwhelming management teams while maintaining momentum through visible progress and stakeholder engagement. This requires careful prioritization of high-impact, achievable improvements over comprehensive transformation programs that may fail due to resource constraints or change fatigue.
Conclusion: Operational Alpha Is Now Table Stakes
The private equity industry has fundamentally shifted from financial engineering to operational excellence as the primary driver of value creation. Firms that execute faster with disciplined operational improvement, data-driven decision making, and systematic governance will outperform through economic cycles regardless of interest rate environments or market conditions.
This transformation reflects structural changes in the industry: higher interest rates that limit the benefits of leverage, increased competition for assets that compresses multiple arbitrage opportunities, and longer holding periods that require sustainable value creation rather than quick financial optimization. Revenue growth now drives 54-71% of total value creation, making operational capabilities essential rather than optional.
The firms building operational alpha capabilities today—through systematic playbook development, talent investment, technology adoption, and change management discipline—will capture the next decade of private equity outperformance. Operational excellence has evolved from a differentiator to table stakes for sustainable value creation in modern private equity.
Ready to Unlock Operational Alpha in Your Portfolio?
Don't let your investments lag while competitors capture 2-18% EBITDA improvements. Our proven operational excellence framework has helped PE firms transform underperforming assets into premium exit candidates.
Schedule Your FREE Operational Assessment
Discover your portfolio's hidden value creation opportunities in 30 minutes.

Pages Related to #Operational Alpha
- When are EB-5 funds required to be deployed?

- ESG Integration in Private Markets: Sustainable Real Estate & Impact Investing Returns

- Private Equity Cash Management: How to Optimize Uncalled Capital

Popular Page
Private Real Estate Funds - Investments to Drive Income and Capital Growth
Book a Free Complimentary Call
Search within Paperfree.com
real estate investing Investment Visa USA Investment Magazine Private Real Estate Funds real estate funds