Cars utilization
In inventory, you can view the status of all of your products and the dates they will be rented. The x-axis of the graph represents the dates, while the y-axis represents the cars/products.
To change the dates which will appear on the graph, simply click on the calendars and change them to the dates you want, as in Figure 1.
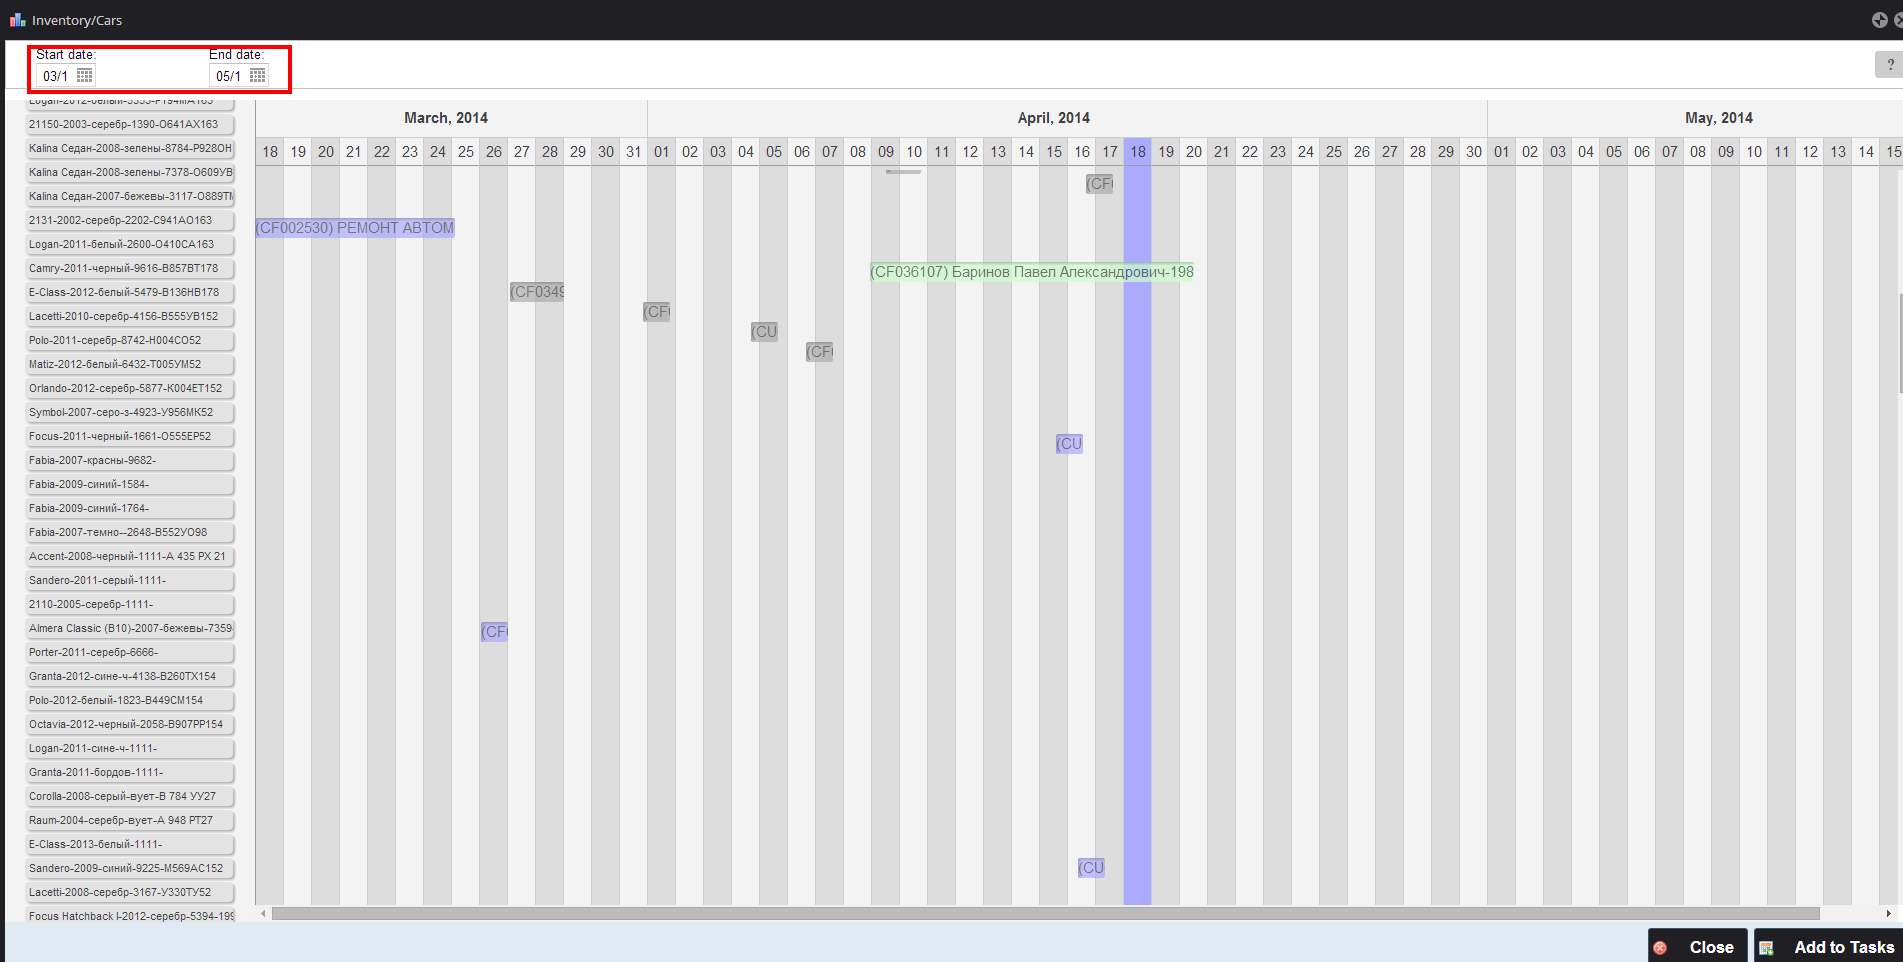 Figure 1
Sponsored from PaperFree Magazine:
.jpg)
Real Estate Investment Principles by Billionaire Bruce Flatt
Copyright © 2022 PaperFree.com Inc. All rights reserved and data products are owned and distributed by PaperFree.com Inc. and its subsidiaries. | About | Feedback | All Contacts | ID: 979-446-8934 S/N 78675-0 | SID 487999-3 | Version 5.2 Powered by PaperFree.com | Legal